


Water Online News for wastewater professionals
to download the white paper by Peter Meyers / Resin Tech Inc.
follow the link above
"In water treatment, we are concerned with silica because of its tendency to form deposits (scale) on surfaces it comes in contact with. In boiler and turbine systems, the deposition is often associated with temperature, pressure, and phase state changes that occur. In microelectronics, the concern is deposition and/or changes to the surface properties of the "silicon" wafers. In this paper, we take up the task of describing the behavior of aqueous silica and of the various water treatment processes used for its removal..."
Popular Posts
-
Water and Wastewater.com Help Forum - Tertiary Treatment Surfactant Foam Question by Hilary - CAMS We have a modified UCT BNR plant ...
-
 --> Characterization of the dispersion properties of carbon nanotubes in ionic liquids by the separation behaviour in the centrifuga...
 -
Scope Selection of emulsifiers and evaluation of emulsion stability is a frequent task. This relates to practical issues like formu...
-
Scope Carbon blacks are widely applied as pigments and fillers in various products (inks, paints, rubber, plastics). A multisampl...
-
CME 2006 World Congress of Emulsions 3 - 6 Oct. 2006, Lyon, France Evaluation of long term stability of model emulsions by multisample analy...
Tuesday, January 25, 2005


Antifouling coatings - TBT- alternatives
The Expert's View: "Jan 12, 2005"
experts view by Sandy Morrison
"Any object left in seawater for some time falls victim to marine fouling - the attachment of algae (seaweeds) and various small marine animals. This can have serious operational and economic consequences - reduced speed and increased fuel consumption for ships, accelerated corrosion and increased risk of storm damage on fixed structures.
For a while, it seemed as though the coatings industry had found the perfect answer to almost every fouling problem: self-polishing coatings which gave a controlled release of the toxin tributyltin (TBT). But TBT has been a victim of its own success:...."
key points
the alternative use of copper containing coatings requires replacement too
"Whales, dolphins and other marine mammals live for decades with little fouling growth on their skins, and release no toxic biocides."
see also Technology update: Antifouling coatings
experts view by Sandy Morrison
"Any object left in seawater for some time falls victim to marine fouling - the attachment of algae (seaweeds) and various small marine animals. This can have serious operational and economic consequences - reduced speed and increased fuel consumption for ships, accelerated corrosion and increased risk of storm damage on fixed structures.
For a while, it seemed as though the coatings industry had found the perfect answer to almost every fouling problem: self-polishing coatings which gave a controlled release of the toxin tributyltin (TBT). But TBT has been a victim of its own success:...."
key points
the alternative use of copper containing coatings requires replacement too
"Whales, dolphins and other marine mammals live for decades with little fouling growth on their skins, and release no toxic biocides."
see also Technology update: Antifouling coatings
Sunday, January 23, 2005
Chelants in Industrial wastewater - From the Water and Wastewater.com Help Forum
Water and Wastewater.com Help Forum - Chelants in Industrial wastewater:
Question by Catman
What can be done to minimize the effect of chelating agents in Industrial Wastewater where we are trying to precipitate metal hydroxides. We do zinc plating and the problem occurs when we get an influx of the cleaning baths into the WWT system. We supposedly don't have any "chelants" in our cleaning baths (according to the suppliers)but there are constituents that act as chelants (Pyrophosphates,etc.)
answer
I would try coagulation with iron salts. If chelating agents are present the iron will partly displace the zinc bound .
The heavy metals will adsorb to the precipitated iron hydroxides.
The phosphates should not interfere.
Addition of minor amounts of flocculants might improve the coagulation/precipitation process.
reply by Catman
Our pH is controlled closely we raise to 9.8 before adding a cationic polymer and gravity flow to a Lamella clarifier where an anionic polymer is added in the flocculation tank. The system is a continuous flow system which runs about 40 gpm. We raise the pH with sodium hydroxide. The cleaners are usually recovered for reuse but on occasion tanks are overflowed or inadvertently dumped to WWT. On these occasions it takes us several hours (sometimes days) to recover from the cleaner influx. We have about 30,000 gallons of capacity in our equalization tanks and the cleaner still causes us problems. Our polymer supplier suggested a calcium magnesium blend product to help with the problem but we see little effect when this is used. They have also mentioned carbamate but we are hesitant to use this due to it's toxicity.
answer by Dedalus
A pH of 9.8 is a little too high for Zn. When I used to treat a lot of cyanide zinc rinses I used 9.3 as my control level.
Sobisch offers good advice - dose with iron salts. I would add: bring the pH down to 3 - 4 before doing so. This tends to protonate things like organic acid salts and EDTA, disrupting metal complexes. If when the pH is raised again, there is a large excess of ferrous or ferric ions, the chelants will latch onto those, leaving the target ions free to be precipitated as hydroxides.
question by Catman
What effect will the iron salts have on the amount of sludge generated? Our filter cake is classified as non-haz and costs little to dispose of, but our filter press is about at capacity. Just wondering if we would have to add a bigger press. At present we aren't lowering the pH of the incoming stream. It generally is around the 5 - 5.5 range. At one time we were having a problem with small spikes of cadmium but have since eliminated the source. We were running the pH at 9.8 - 9.9 to try and catch the zinc and the cadmium. Since the cadmium is no longer an issue should we lower the pH regardless of whether we add the iron salts?
answer by Dedalus
A modest dose of ferrous sulfate at the incoming pH ought to help you. I would avoid the use of ferric salts, which will precipitate immediately at the pH you indicated, giving little benefit from coprecipitation.
You will see some increase in sludge volumes from this addition. The main thing is to be moderate and use only as much ferrous sulfate as is needed to produce the desired effect.
Can you batch treat those cleaners? They are notorious for causing system upsets. I always excluded them from continuous flow systems I was responsible for running.
And, don't forget to change the final precipitation pH. You will do much better with Zn at 9 - 9.3.
answer by Superglide
I have a little experience with Chelants giving me problems. The stuff is in everything. Some worse than others. I use a chemical called Clearmet. It's really just organic sulfur, but it is not pH dependent. I have found that just relying on solubility curves with pH, will not solve your problem. That only seems to work in the lab. Try as much product substitution upstream as possible.
comment by Dedalus
Re: Solubility products, solubility curves, etc. Superglide is entirely right. They will not reliably predict what will work. If I had a nickel for every time some...person from the front office came to visit me in the field with a table of theoretical data that was supposed to solve my problems, I could retire. My pH 9.3 value was derived from actual batch treatments, not textbook data.
What that theoretical stuff is good for is not telling you what will work, but what absolutely will not work. This can cut down the number of bench tests and sour batches considerably.
Question by Catman
What can be done to minimize the effect of chelating agents in Industrial Wastewater where we are trying to precipitate metal hydroxides. We do zinc plating and the problem occurs when we get an influx of the cleaning baths into the WWT system. We supposedly don't have any "chelants" in our cleaning baths (according to the suppliers)but there are constituents that act as chelants (Pyrophosphates,etc.)
answer
I would try coagulation with iron salts. If chelating agents are present the iron will partly displace the zinc bound .
The heavy metals will adsorb to the precipitated iron hydroxides.
The phosphates should not interfere.
Addition of minor amounts of flocculants might improve the coagulation/precipitation process.
reply by Catman
Our pH is controlled closely we raise to 9.8 before adding a cationic polymer and gravity flow to a Lamella clarifier where an anionic polymer is added in the flocculation tank. The system is a continuous flow system which runs about 40 gpm. We raise the pH with sodium hydroxide. The cleaners are usually recovered for reuse but on occasion tanks are overflowed or inadvertently dumped to WWT. On these occasions it takes us several hours (sometimes days) to recover from the cleaner influx. We have about 30,000 gallons of capacity in our equalization tanks and the cleaner still causes us problems. Our polymer supplier suggested a calcium magnesium blend product to help with the problem but we see little effect when this is used. They have also mentioned carbamate but we are hesitant to use this due to it's toxicity.
answer by Dedalus
A pH of 9.8 is a little too high for Zn. When I used to treat a lot of cyanide zinc rinses I used 9.3 as my control level.
Sobisch offers good advice - dose with iron salts. I would add: bring the pH down to 3 - 4 before doing so. This tends to protonate things like organic acid salts and EDTA, disrupting metal complexes. If when the pH is raised again, there is a large excess of ferrous or ferric ions, the chelants will latch onto those, leaving the target ions free to be precipitated as hydroxides.
question by Catman
What effect will the iron salts have on the amount of sludge generated? Our filter cake is classified as non-haz and costs little to dispose of, but our filter press is about at capacity. Just wondering if we would have to add a bigger press. At present we aren't lowering the pH of the incoming stream. It generally is around the 5 - 5.5 range. At one time we were having a problem with small spikes of cadmium but have since eliminated the source. We were running the pH at 9.8 - 9.9 to try and catch the zinc and the cadmium. Since the cadmium is no longer an issue should we lower the pH regardless of whether we add the iron salts?
answer by Dedalus
A modest dose of ferrous sulfate at the incoming pH ought to help you. I would avoid the use of ferric salts, which will precipitate immediately at the pH you indicated, giving little benefit from coprecipitation.
You will see some increase in sludge volumes from this addition. The main thing is to be moderate and use only as much ferrous sulfate as is needed to produce the desired effect.
Can you batch treat those cleaners? They are notorious for causing system upsets. I always excluded them from continuous flow systems I was responsible for running.
And, don't forget to change the final precipitation pH. You will do much better with Zn at 9 - 9.3.
answer by Superglide
I have a little experience with Chelants giving me problems. The stuff is in everything. Some worse than others. I use a chemical called Clearmet. It's really just organic sulfur, but it is not pH dependent. I have found that just relying on solubility curves with pH, will not solve your problem. That only seems to work in the lab. Try as much product substitution upstream as possible.
comment by Dedalus
Re: Solubility products, solubility curves, etc. Superglide is entirely right. They will not reliably predict what will work. If I had a nickel for every time some...person from the front office came to visit me in the field with a table of theoretical data that was supposed to solve my problems, I could retire. My pH 9.3 value was derived from actual batch treatments, not textbook data.
What that theoretical stuff is good for is not telling you what will work, but what absolutely will not work. This can cut down the number of bench tests and sour batches considerably.
Wednesday, December 22, 2004
Filtech 2005 - Tracing the centrifugal separation of fine-particle slurries
Filtech Conference & Exhibition for Filtration and Separation Technology
October 11 - 13, 2005 Wiesbaden, Germany
abstract submitted
October 11 - 13, 2005 Wiesbaden, Germany
abstract submitted
Tracing the centrifugal separation of fine-particle slurries
Effect of centrifugal acceleration, particle interaction and concentration
T. Sobisch*, D. Lerche, L.U.M. GmbH, Berlin, www.lum-gmbh.com, info@lum-gmbh.de
M. Beiser, A. Erk, Institut für Mechanische Verfahrenstechnik und Mechanik, Universität Karlsruhe (TH)
Unit processes using centrifugal fields are often applied for separation and classification of fine grained materials. Modelling of these processes requires information about the separation behaviour of the suspensions to be processed. To this end direct measurements in centrifuges are obligatory. Moreover, these measurements have to gather kinetic information as function of the processing conditions, particle interaction and particle concentration.
As a first step in this direction the separation behaviour of quartz (stable dispersions) and limestone suspensions (weakly and strongly flocculated) was investigated as function of solid concentration and centrifugal acceleration (11 – 1100 x g) using a multisample analytical centrifuge.
Particle interactions are characterized by determination of the packing density obtained under controlled conditions and by its variations under alternating centrifugal load.
Results of analytical centrifugation are compared with the separation behaviour under normal gravity and with the results traced by a centrifuge with manometric detection.
Centrifugation, solid-liquid separation, sedimentation, classification, physico-chemical aspects
Traditional Chemical Cleaning Products in Wastewatertreatment - From the Help Forum Waterand Wastewater.com
Water and Wastewater.com Help Forum - Traditional Chemical Cleaning Products in WW
Question by Ianf
what problems/issues do traditional cleaning products pose for todays waste water systems.
EDTA, anti-microbial sprays, etc..etc
answer
Cleaning products are really a very broad family of products (from household cleaners to industrial cleaners for very different purposes). I would suggest to omit 'traditional' from the question raised. Some 'traditional' cleaners might be classified as eco friendly, while some newly developed products might imply several threats to the environment.
I would not consider anti-microbial sprays as related products, however, often unnecessarily anti-microbial agents are included in cleaning products.
In summary it is the responsibility of the manufacturers of excluding/replacing harmful compounds and of the consumers (individuals and industrial alike) of looking for safe products.
EDTA and NTA (an alternative complexing agent) and antimicrobial agents are one major problem.
Further, the use of surfactants with limited biodegradability - one major group of concern nonionic surfactants of the alkyl phenol type (several times discussed at this forum) and the use of chlor related products for bleaching.
In almost every case safer alternatives exist!
comment by Victor Santa Cruz
One of the few problems associated with chemicals coming into a wastewater treatment plant is the inability of both physiochemical and biological process being unable to remove/degrade the chemical in question. Take for example the chemical 3,4,4'-trichlorocarbanilide (triclocarban or TCC). It is an ingredient normally added to those hand soaps, cleaners, and other personal care products to kill germs. According to research conducted at John Hopkins University Bloomberg School of Public Health (Baltimore) this chemical persists in the environment long after it has been used. The researchers' study of triclocarban contamination in US waters resources was published in the August online edition of Environmental Science and Technology. Also, the persistence of these antiobiotic chemicals radically changes their effectiveness as biocides, since the bacteria become immune to them.
reply by Ianf
Our company has for many years produced liquid microbial formulations for the very small end wws, septic tanks, ATS, etc etc. The products worked very well until the next influx of chemical cleaner/s killed of the micro activity.
To do away with this boom bust cycle our customers asked if we could work on wws friendly cleaning formulations....which we did.
I have no expertise in commercial WWS.......and I just wondered if large WWS facilities face the same dramas as the very small insitu systems.
We have aimed for a total product biodegradable target of <28 days....is this relevant or helpful for the end treatment plant.
reply
though I am not able to help you with the new question here a supplement.
Further to consider extreme pH range (acidic or basic cleaners), which gets a problem when not neutralized.
Solvent based cleaners, which become a problem when hazardous solvents are used.
A 'good' example is the cleaner 'Simple Green', which does not contain a 'green' solvent but the blood poison butoxyethanol.
Question by Ianf
what problems/issues do traditional cleaning products pose for todays waste water systems.
EDTA, anti-microbial sprays, etc..etc
answer
Cleaning products are really a very broad family of products (from household cleaners to industrial cleaners for very different purposes). I would suggest to omit 'traditional' from the question raised. Some 'traditional' cleaners might be classified as eco friendly, while some newly developed products might imply several threats to the environment.
I would not consider anti-microbial sprays as related products, however, often unnecessarily anti-microbial agents are included in cleaning products.
In summary it is the responsibility of the manufacturers of excluding/replacing harmful compounds and of the consumers (individuals and industrial alike) of looking for safe products.
EDTA and NTA (an alternative complexing agent) and antimicrobial agents are one major problem.
Further, the use of surfactants with limited biodegradability - one major group of concern nonionic surfactants of the alkyl phenol type (several times discussed at this forum) and the use of chlor related products for bleaching.
In almost every case safer alternatives exist!
comment by Victor Santa Cruz
One of the few problems associated with chemicals coming into a wastewater treatment plant is the inability of both physiochemical and biological process being unable to remove/degrade the chemical in question. Take for example the chemical 3,4,4'-trichlorocarbanilide (triclocarban or TCC). It is an ingredient normally added to those hand soaps, cleaners, and other personal care products to kill germs. According to research conducted at John Hopkins University Bloomberg School of Public Health (Baltimore) this chemical persists in the environment long after it has been used. The researchers' study of triclocarban contamination in US waters resources was published in the August online edition of Environmental Science and Technology. Also, the persistence of these antiobiotic chemicals radically changes their effectiveness as biocides, since the bacteria become immune to them.
reply by Ianf
Our company has for many years produced liquid microbial formulations for the very small end wws, septic tanks, ATS, etc etc. The products worked very well until the next influx of chemical cleaner/s killed of the micro activity.
To do away with this boom bust cycle our customers asked if we could work on wws friendly cleaning formulations....which we did.
I have no expertise in commercial WWS.......and I just wondered if large WWS facilities face the same dramas as the very small insitu systems.
We have aimed for a total product biodegradable target of <28 days....is this relevant or helpful for the end treatment plant.
reply
though I am not able to help you with the new question here a supplement.
Further to consider extreme pH range (acidic or basic cleaners), which gets a problem when not neutralized.
Solvent based cleaners, which become a problem when hazardous solvents are used.
A 'good' example is the cleaner 'Simple Green', which does not contain a 'green' solvent but the blood poison butoxyethanol.
Monday, December 20, 2004
Cosmetics and Colloids 2005 - SCI Conference
Presentation at the Cosmetics and Colloids conference
Tuesday 15 February - SCI, 14/15 Belgrave Square, London, UK
Organized by the SCI Colloid and Surface Chemistry Group, the SCI Biotechnology Group, the RSC Colloid and Interface Science Group and the Society of Cosmetic Scientists
Rapid characterization of emulsions for emulsifier selection, quality control and evaluation of stability using multisample analytical centrifugation
T. Sobisch, D. Lerche, L.U.M. GmbH
Rudower Chaussee 29 (OWZ) 12489 Berlin / Germany
Selection of emulsifiers and evaluation of emulsion stability is a frequent task in the cosmetic sector. This relates to practical issues like formulation of emulsions, optimization of manufacturing, quality control, and shelf life prediction.
A multisample technique based on analytical centrifugation is presented which allows for an accelerated study of creaming and of separation of oil and water phases. Not only information on the extent of phase separation is provided but also the kinetics are directly measured in-situ. The latter is of great practical importance for estimation of shelf life and in relation to the engineering of separation processes.
Results of investigations on emulsion stability behaviour as function of polarity and composition of nonionic emulsifiers, polarity of the oil phase, preparation conditions and of temperature are presented.
The investigations revealed that the method applied is very suitable for screening purposes, optimization of emulsion manufacturing and that time of investigation and centrifugal acceleration can be adapted to avoid conditions were centrifugal forces are the determining factor for phase separation.
Keywords: emulsion stability, analytical centrifugation, emulsion preparation, emulsifier and demulsifier selection, oil-in-water and water-in-oil-emulsions
Characterization and optimization of emulsions by multisample analytical centrifugation
Scope
Selection of emulsifiers and evaluation of emulsion stability is a frequent task. This relates to practical issues like formulation of emulsions, optimization of manufacturing, quality control, shelf life prediction and breaking of emulsions.
A multisample technique based on analytical centrifugation is described which allows for an accelerated characterization of emulsions without dilution, thus avoiding changes of emulsion properties.
Measurement principle
The Lumifuge measures the intensity of the transmitted light over the full sample length simultaneously as function of time. (Measurement scheme see Fig. 1)
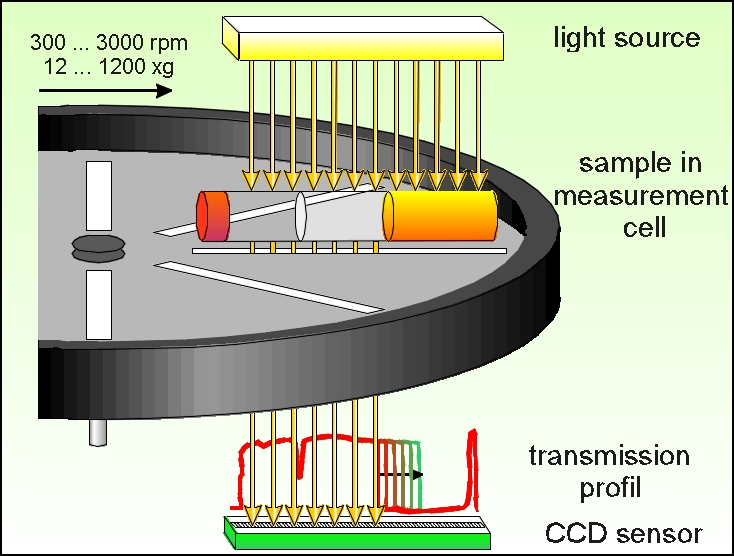
Fig. 1 Lumifuge - Measurement scheme
The data are displayed as function of the radial position, as distance from the centre of the rotation (transmission profiles, see Fig. 2).
At the same time up to 8 different samples can be analysed simultaneously at temperatures up to 60 °C.
By means of the available analysis modes ‘Integral Transmission’ (Clarification) and ‘Front Tracking’ the separation behaviour of the individual samples can be compared and analysed in detail.
Information accessible by analytical centrifugation
Figure 2 shows as an example the set of transmission profiles obtained for an oil-in-water (o/w) emulsion analysed at 3000 rpm (1100 x g).
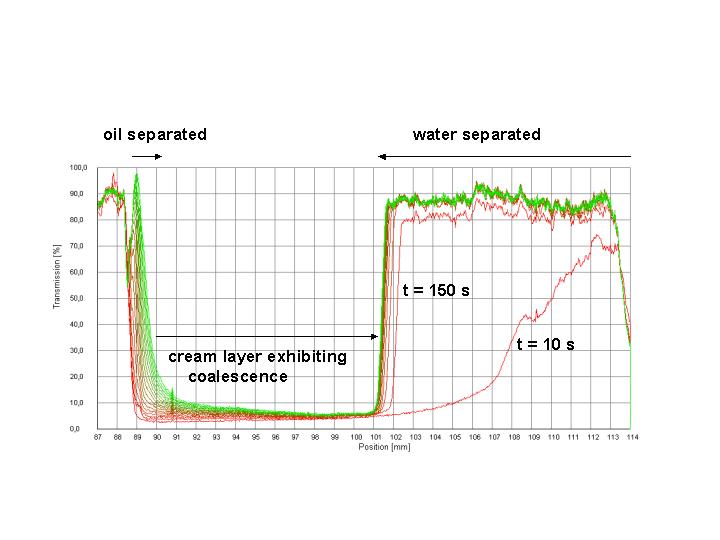
Fig. 2 Evolution of transmission profiles with time - first recorded profile undermost, last profile uppermost, centrifugation of an o/w emulsion, 3000 rpm (1100 x g)
The sharp drop in transmission below 89 mm marks the filling height of the sample.
The lowest transmission belongs to the first profile (red). The primary separation process, separation of an aqueous phase, starts from the bottom of the cell. The boundary water -emulsion is moving upwards (last profile green). That is, the separation process is characterized by creaming of oil droplets inside the continuous aqueous phase.
· The type of emulsion oil-in-water (o/w) or water-in-oil (w/o) can easily be deduced from the primary process of destabilization traced by the evolution of transmission profiles.
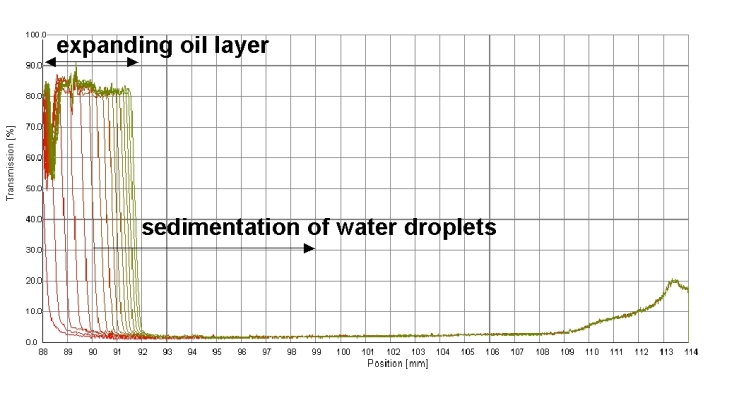
Fig. 3 Evolution of transmission profiles with time - first recorded profile undermost, last profile uppermost, centrifugation of a w/o emulsion, 3000 rpm (1100 x g)
An example of the typical separation behaviour of a water-in-oil (w/o) emulsion is shown in Fig. 3. The primary process of destabilization traced is sedimentation of water droplets inside the continuous oil phase. (The increase of the baseline above 109 mm is due to the transparent cell basement and therefore not related to the separation process.)
- The kinetics of creaming (or sedimentation) and oil layer formation as well as the kinetics of coalescence can be analysed and compared with other samples using the integrated software (Fig. 4).
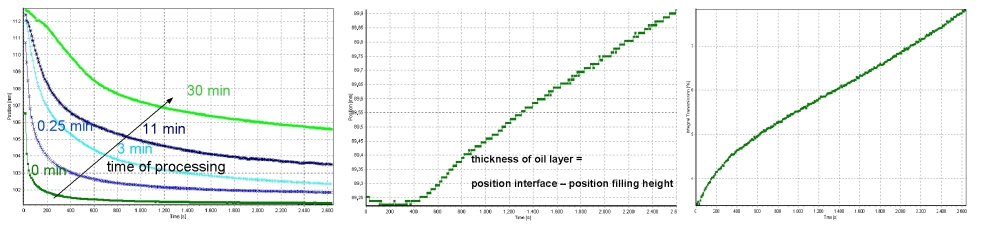
Fig. 4 Kinetics of creaming - left, and of evolution of the oil layer - middle (analysis mode ‘Front Tracking’) as well as of coalescence -right (analysis mode ‘Integral Transmission’) can be easily traced
Kinetics of creaming - comparison of emulsion samples taken after different times of processing - after prolonged time of stirring samples are more stable against creaming
Kinetics of oil layer evolution for an o/w emulsion (process depicted in Fig. 2) - after a distinct time lag (formation of a thin extended oil film as a result of coalescence) oil layer thickens with varying speed
Kinetics of coalescence (process depicted in Fig. 2) is traced by the evolution of the average transmission of the cream layer with time
· The dependence of creaming velocity (and of kinetics of other processes traced) on centrifugal acceleration can be measured, which is necessary for extrapolation to normal gravity

Fig. 5 Dependence of creaming velocity on centrifugal acceleration for paraffin oil emulsions as function of paraffin oil / water ratio (m/m).
Centrifugation for 2 hours at varying centrifugal speeds
Examples of application
In the following the ratio of the total liquid separated relative to the entire sample volume was chosen as an easy measure of emulsion stability. The higher this value the lower the stability. After a simple calibration the relation between the radial position and volume can be established.
· Effect of stirring time and emulsifier on emulsion stability
Coarse emulsions containing 5 % m/m surfactant were intensively homogenized with a laboratory dissolver. Samples were taken in between 0 and 30 minutes during homogenisation. Values depicted were obtained during one run of the instrument for each emulsifier (commercial ethoxylated surfactants with a varying degree of Ethoxylation – EO).

Fig. 6 Selected results on the change of emulsion stability for rapeseed oil emulsions (1/1 oil/water m/m) as function of processing time and emulsifier applied.
EO6 (5+7) and (3+12) are respective blends of iso Tridecanol (3, 5, 7 and 12 EO) with a nominal ethoxylation degree of 6
Stability evaluated via the ratio of the total liquid separated relative to the entire sample volume.
Centrifugation at 3000 rpm for 43 minutes.
Stability increases almost linearly with processing time after an initial sharp improvement relative to the coarse emulsions. The surfactant with 5 EO units is the most effective emulsifier. Blending of surfactants is often used to adjust the polarity of the emulsifier to the actual need. As obvious from Fig. 6 not only the average polarity is a key in determining emulsion stability but also the oligomer distribution. The performance of the blend “5+7” ranges between the efficiency of emulsifiers with nominal 5 and 7 EO units, however, “3+12” is only as efficient as the emulsifier with 12 EO.
· Effect of HLB-value and temperature on emulsion stability
o/w Emulsions were prepared at a paraffin oil/water ratio of 1/1 m/m using a mixture of an oil and a water soluble emulsifier. The HLB value of the emulsifier was shifted by varying the emulsifier composition. The temperature dependence of emulsion stability can easily be assessed by centrifugation at different temperatures.

Fig. 7 Dependence of emulsion stability on emulsifier composition (HLB value) and temperature for paraffin oil emulsions (1/1 oil/water m/m).
Stability evaluated via the ratio of the total liquid separated relative to the entire sample volume.
Centrifugation at 3000 rpm for 43 minutes.
 Emulsion stability decreases when temperature is increased. Near the optimum HLB value stability is less dependent on temperature. At higher temperatures the optimum HLB is shifted to higher values.
Thursday, December 09, 2004
Selection of lime dispersing agents by multisample analytical centrifugation
Scope
Effective dispersion of lime is required in laundry applications as well as in papermaking, paints and other filed. To this end efficient stabilizers and their right concentration has to be selected.
A multisample technique based on analytical centrifugation is described which allows for an accelerated study of dispersion stability without dilution, thus avoiding changes of dispersion properties.
The efficiency of this approach is demonstrated by evaluation of the optimum dispersant concentration and by screening of a range of potential lime dispersants.
Measurement principle
The LumiFuge measures the intensity of the transmitted light over the full sample length simultaneously as function of time. (Measurement scheme see Fig. 1)
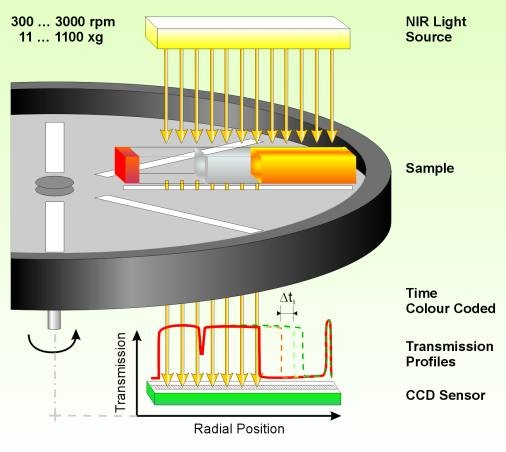
Fig. 1 Lumifuge - Measurement scheme
The data are displayed as function of the radial position, as distance from the centre of the rotation (transmission profiles, see Fig. 2).
At the same time up to 8 different samples can be analysed simultaneously.
By means of the available analysis modes ‘Integral Transmission’ (Clarification) and ‘Front Tracking’ the separation behaviour of the individual samples can be compared and analysed in detail.
Experimental/Results
1 % m/m aqueous lime dispersions were prepared with varying concentrations of sodium alkylbenzene sulfonate (ABS-Na) or with the addition of different dispersing agents. The separation stability was analysed at 1000 rpm (128 x g).
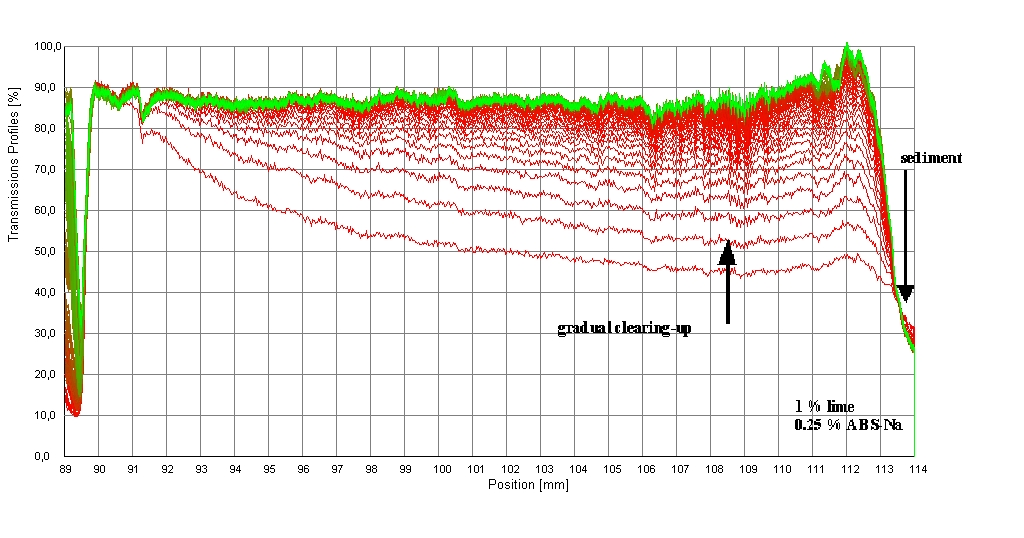
Fig. 2 Evolution of transmission profiles with time - first recorded profile undermost, last profile uppermost, centrifugation of a lime dispersion stabilized by a commercial anionic surfactant, 1000 rpm (128 x g)
The set of transmission profiles obtained for the dispersion stabilized by an alkylbenzene sulfonate is representative for the sedimentation of a very polydisperse suspension. As an easy measure of stability the transmission after 45 minutes of centrifugation was chosen. To this end the transmission values were averaged over the sample length between the radial position 101 and 103 mm using the analysis mode ‘Integral Transmission’. The higher the transmission the lower the stability. This way the stabilization effect can directly be visualized (Fig. 3 and 4).
Fig. 3 displays the dependence of dispersion stability on concentration of the anionic dispersant. Values depicted were obtained during one run of the instrument.
Fig. 4 shows a direct comparison of the performance of different dispersants. The acryl amide acrylate copolymer is the far most efficient dispersant resulting in the highest residual turbidity (lowest transmission).
From this figure the advantage of comparing multiple samples during one measurement under identical conditions becomes evident.
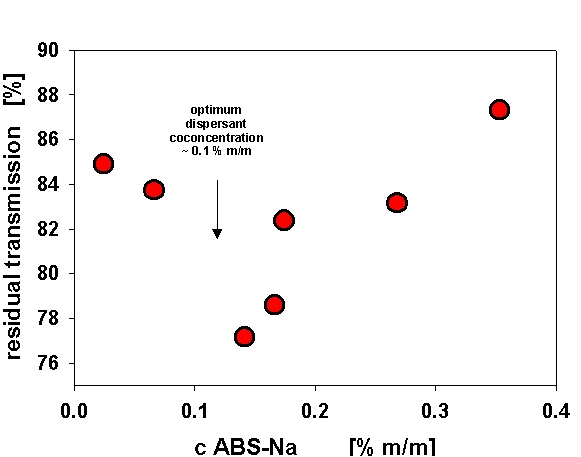
Fig. 3 Stabilization of lime dispersions by an anionic dispersant - effect of dispersant concentration, high transmission after 45 min of centrifugation means low stability.
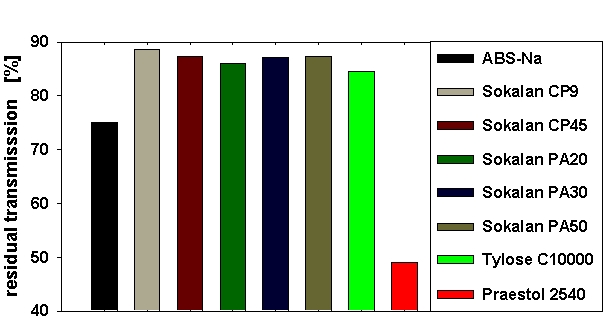
Fig. 4 Direct comparison of performance of different dispersants in lime stabilization (0.1 m/m %) - high transmission after 45 min of centrifugation means low stability.
MPK (methyl propyl ketone) as Replacement for MEK Solvents
Product News - Eastman Offers Efficient, Non-HAP Replacement for MEK Solvents
MEK - Methyl ethyl ketone is considered to be a 'HAP solvent'. As I found out this abbreviation means 'Hazardous Air Pollutant'.
MEK has wide ranging applications as solvent for paints, cleaners and paint strippers
MEK - Methyl ethyl ketone is considered to be a 'HAP solvent'. As I found out this abbreviation means 'Hazardous Air Pollutant'.
MEK has wide ranging applications as solvent for paints, cleaners and paint strippers
Wednesday, December 08, 2004
Lumifuge/Lumisizer/Lumireader - How to determine the position of the bottom of the measuring cells and How to determine volumes (sediment, cream )
The detection principle of the Lumifuge/Lumisizer and Lumireader instruments allows to determine the local position with high precision.
For more advanced applications (determination of sediment heights for example) the knowledge of the position of the bottom of the measuring cells might be necessary. To determine the packing density or to determine the phase ratio of phases separated, it is straight forward to determine these values after calibration by inserting the values obtained for the respective position into an equation.
How to do the calibration ?
The procedure to follow is based on two simple facts
- mass of samples can be easily measured with high precision
- the position of the air-liquid interface is easily obtained from the transmission profiles, see below
#1 For a given type of measuring cells, i.e. rectangular plastic cells or glass cells, a set of samples are filled to different heights with water (density equals 1 g / cm³) with the sample mass determined by a semi-analytical balance (± 1 mg).
#2 Transmission profiles of these samples are obtained using the Lumifuge (up to eight samples per measurement) or the Lumireader.
#3 The position of the interface air-water is determined for each sample
#4 Via fitting a convenient equation the dependence volume-position and position-volume can be obtained, which also gives the position relating to ‘zero volume’, i.e. the position at the bottom
Ten sample cells were filled with water (range 25 mg – 825 mg). For the transmission profiles obtained, see two examples below for 151 and 407 mg, respectively.
For round glass cells with a diameter of 10 mm a range of 150 mg to 5000 mg would be appropriate.
For the Lumifuge with a shorter line detector a range of 20 to 400 mg and 200 – 2700 mg, respectively, is applicable.
One has to take care of the precise placing of the sample cells.
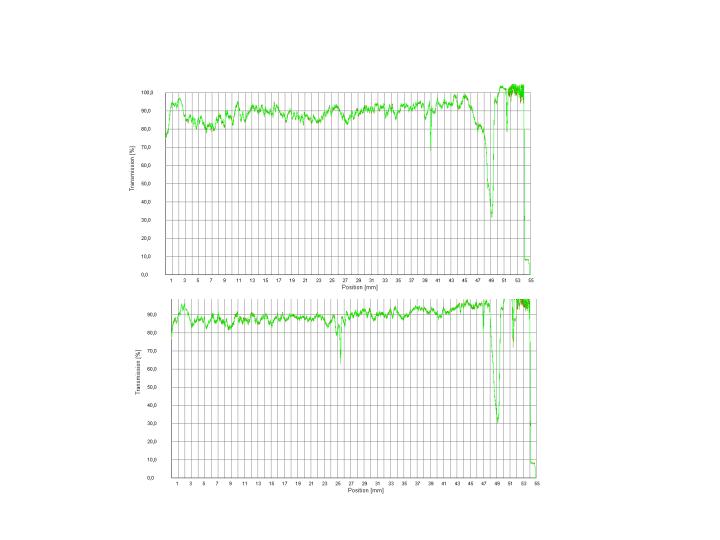
Transmission profiles obtained with the Lumireader 4160-101, plastic rectangular cells, polycarbonate, filled with water 151 (upper figure) and 407 mg (lower figure).
The drop in transmission around position 49 mm (given as distance from the upper end of the CCD line sensor) is caused by the bottom of the cell, however, its position cannot be deduced exactly.
The position of the interface air-water (sharp incline) reads 40.1 and 25.6 mm for the samples with 151 mg (upper figure) and with 407 mg (lower figure), respectively.
For the following set of data the results are depicted below

calibration data and plot
Fitted with the equation of type y = a + bx + cx² (eq. 1) one gets
a = 48.78 (position of the cell bottom, i.e. 48.8 mm)
b = - 0.05895
c = 0.000004603
Please note, this is the relation of position as function of the sample mass.
For the determination of volume in relation to the position, however, one needs an equation to compute the volume by inserting the values determined for the position.
The same type of fitting equation might be used as above y = a + bx + cx² (eq. 2)
with y for volume (mm³ or µl) and x for the position.
The regression results in
a = 888.7 (maximum volume traceable, i.e. 888 mm³)
b = -19.56
c = 0.02762
With the knowledge of these parameters and the equation above (eq. 2) one can compute any volume of sediment or the volume of the whole sample. The value of a cream layer or a floating oil layer can be determined by subtracting the volume relating to the position of the interface from the volume of the whole sample accordingly.
Example – Determination of sediment volume and packing density
Below the transmission profile of a flocculated sample of colloidal silica which was measured at gravity to deduce the change in packing density after compaction in a centrifugal field.
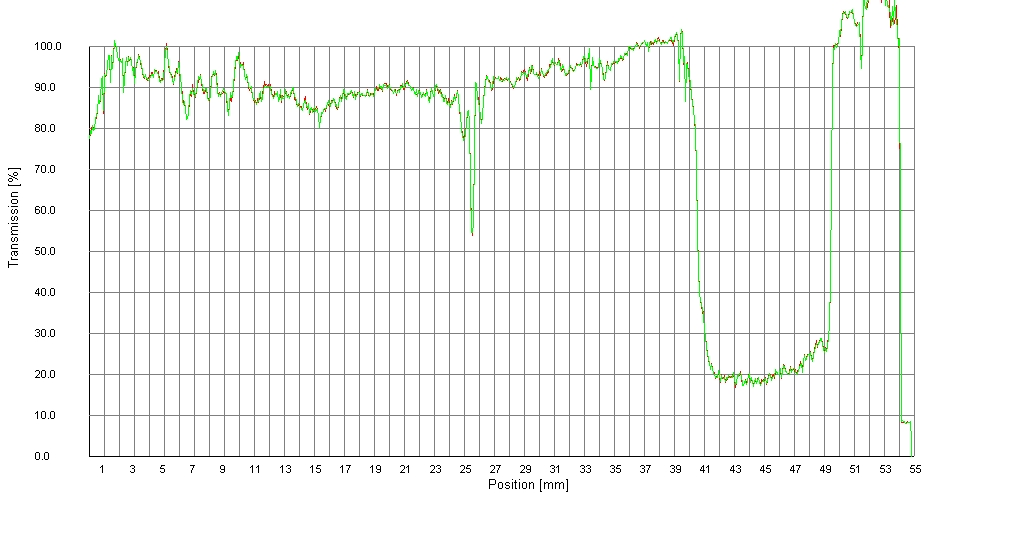
Transmission profiles of a flocculated sample of colloidal silica after compaction in a centrifugal field.
The position of the interface air-water is at 25.6 mm relating to a volume of 406 mm³, the position of the sediment interface is at 40.3 mm corresponding to 145 mm³. The layer of water above the sediment, therefore, has a volume of 261 mm³.
The packing density of silica can be expressed in terms of volume fraction:
F = m/(rV) (eq. 3)
with the mass of silica m (in this case 10 mg), a density r of 2.3 g/cm³ or mg/mm³ and the volume of silica V (145 mm³, see above).
According equation (3) the packing density of silica measured results in a volume fraction F of 0.03, very far from a dense packing.
Online Survey of the European Environmental Agency - Air Pollution
IPM V 1.4
"The European Commission is writing an action plan to improve air quality in Europe. It will include measures having a direct influence on our day to day life. The way we move, the way we produce and use energy, the air quality we want, the price of products and services are all at issue in this plan. Therefore your opinion on air pollution and its effects is of great importance to us. It will help us finalize the plan."
"The European Commission is writing an action plan to improve air quality in Europe. It will include measures having a direct influence on our day to day life. The way we move, the way we produce and use energy, the air quality we want, the price of products and services are all at issue in this plan. Therefore your opinion on air pollution and its effects is of great importance to us. It will help us finalize the plan."
Subscribe to:
Posts (Atom)