Titus Sobisch eXTReMe Tracker

Popular Posts

Wednesday, December 22, 2004

Filtech 2005 - Tracing the centrifugal separation of fine-particle slurries

Filtech Conference & Exhibition for Filtration and Separation Technology
October 11 - 13, 2005 Wiesbaden, Germany

abstract submitted

Tracing the centrifugal separation of fine-particle slurries

Effect of centrifugal acceleration, particle interaction and concentration

T. Sobisch*, D. Lerche, L.U.M. GmbH, Berlin, www.lum-gmbh.com, info@lum-gmbh.de

M. Beiser, A. Erk, Institut für Mechanische Verfahrenstechnik und Mechanik, Universität Karlsruhe (TH)

Unit processes using centrifugal fields are often applied for separation and classification of fine grained materials. Modelling of these processes requires information about the separation behaviour of the suspensions to be processed. To this end direct measurements in centrifuges are obligatory. Moreover, these measurements have to gather kinetic information as function of the processing conditions, particle interaction and particle concentration.

As a first step in this direction the separation behaviour of quartz (stable dispersions) and limestone suspensions (weakly and strongly flocculated) was investigated as function of solid concentration and centrifugal acceleration (11 – 1100 x g) using a multisample analytical centrifuge.

Particle interactions are characterized by determination of the packing density obtained under controlled conditions and by its variations under alternating centrifugal load.

Results of analytical centrifugation are compared with the separation behaviour under normal gravity and with the results traced by a centrifuge with manometric detection.

Centrifugation, solid-liquid separation, sedimentation, classification, physico-chemical aspects


Traditional Chemical Cleaning Products in Wastewatertreatment - From the Help Forum Waterand Wastewater.com

Water and Wastewater.com Help Forum - Traditional Chemical Cleaning Products in WW

Question by Ianf
what problems/issues do traditional cleaning products pose for todays waste water systems.
EDTA, anti-microbial sprays, etc..etc

answer
Cleaning products are really a very broad family of products (from household cleaners to industrial cleaners for very different purposes). I would suggest to omit 'traditional' from the question raised. Some 'traditional' cleaners might be classified as eco friendly, while some newly developed products might imply several threats to the environment.

I would not consider anti-microbial sprays as related products, however, often unnecessarily anti-microbial agents are included in cleaning products.

In summary it is the responsibility of the manufacturers of excluding/replacing harmful compounds and of the consumers (individuals and industrial alike) of looking for safe products.

EDTA and NTA (an alternative complexing agent) and antimicrobial agents are one major problem.
Further, the use of surfactants with limited biodegradability - one major group of concern nonionic surfactants of the alkyl phenol type (several times discussed at this forum) and the use of chlor related products for bleaching.

In almost every case safer alternatives exist!

comment by Victor Santa Cruz
One of the few problems associated with chemicals coming into a wastewater treatment plant is the inability of both physiochemical and biological process being unable to remove/degrade the chemical in question. Take for example the chemical 3,4,4'-trichlorocarbanilide (triclocarban or TCC). It is an ingredient normally added to those hand soaps, cleaners, and other personal care products to kill germs. According to research conducted at John Hopkins University Bloomberg School of Public Health (Baltimore) this chemical persists in the environment long after it has been used. The researchers' study of triclocarban contamination in US waters resources was published in the August online edition of Environmental Science and Technology. Also, the persistence of these antiobiotic chemicals radically changes their effectiveness as biocides, since the bacteria become immune to them.

reply by Ianf
Our company has for many years produced liquid microbial formulations for the very small end wws, septic tanks, ATS, etc etc. The products worked very well until the next influx of chemical cleaner/s killed of the micro activity.

To do away with this boom bust cycle our customers asked if we could work on wws friendly cleaning formulations....which we did.

I have no expertise in commercial WWS.......and I just wondered if large WWS facilities face the same dramas as the very small insitu systems.

We have aimed for a total product biodegradable target of <28 days....is this relevant or helpful for the end treatment plant.


reply
though I am not able to help you with the new question here a supplement.

Further to consider extreme pH range (acidic or basic cleaners), which gets a problem when not neutralized.

Solvent based cleaners, which become a problem when hazardous solvents are used.
A 'good' example is the cleaner 'Simple Green', which does not contain a 'green' solvent but the blood poison butoxyethanol.

Monday, December 20, 2004

Cosmetics and Colloids 2005 - SCI Conference

Presentation at the Cosmetics and Colloids conference
Tuesday 15 February - SCI, 14/15 Belgrave Square, London, UK

Organized by the SCI Colloid and Surface Chemistry Group, the SCI Biotechnology Group, the RSC Colloid and Interface Science Group and the Society of Cosmetic Scientists


Rapid characterization of emulsions for emulsifier selection, quality control and evaluation of stability using multisample analytical centrifugation

T. Sobisch, D. Lerche, L.U.M. GmbH

Rudower Chaussee 29 (OWZ) 12489 Berlin / Germany

info@lum-gmbh.de


Selection of emulsifiers and evaluation of emulsion stability is a frequent task in the cosmetic sector. This relates to practical issues like formulation of emulsions, optimization of manufacturing, quality control, and shelf life prediction.

A multisample technique based on analytical centrifugation is presented which allows for an accelerated study of creaming and of separation of oil and water phases. Not only information on the extent of phase separation is provided but also the kinetics are directly measured in-situ. The latter is of great practical importance for estimation of shelf life and in relation to the engineering of separation processes.

Results of investigations on emulsion stability behaviour as function of polarity and composition of nonionic emulsifiers, polarity of the oil phase, preparation conditions and of temperature are presented.

The investigations revealed that the method applied is very suitable for screening purposes, optimization of emulsion manufacturing and that time of investigation and centrifugal acceleration can be adapted to avoid conditions were centrifugal forces are the determining factor for phase separation.

Keywords: emulsion stability, analytical centrifugation, emulsion preparation, emulsifier and demulsifier selection, oil-in-water and water-in-oil-emulsions


Characterization and optimization of emulsions by multisample analytical centrifugation

Scope

Selection of emulsifiers and evaluation of emulsion stability is a frequent task. This relates to practical issues like formulation of emulsions, optimization of manufacturing, quality control, shelf life prediction and breaking of emulsions.

A multisample technique based on analytical centrifugation is described which allows for an accelerated characterization of emulsions without dilution, thus avoiding changes of emulsion properties.

Measurement principle

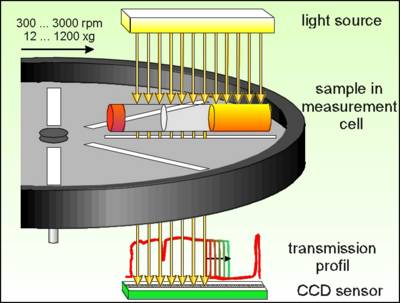
The Lumifuge measures the intensity of the transmitted light over the full sample length simultaneously as function of time. (Measurement scheme see Fig. 1)


Fig. 1 Lumifuge - Measurement scheme

The data are displayed as function of the radial position, as distance from the centre of the rotation (transmission profiles, see Fig. 2).

At the same time up to 8 different samples can be analysed simultaneously at temperatures up to 60 °C.

By means of the available analysis modes ‘Integral Transmission’ (Clarification) and ‘Front Tracking’ the separation behaviour of the individual samples can be compared and analysed in detail.

Information accessible by analytical centrifugation

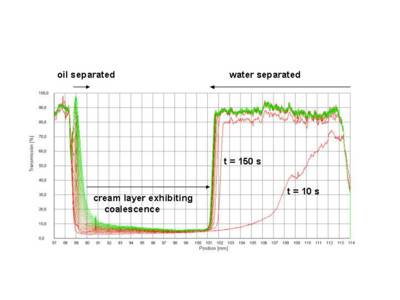
Figure 2 shows as an example the set of transmission profiles obtained for an oil-in-water (o/w) emulsion analysed at 3000 rpm (1100 x g).


Fig. 2 Evolution of transmission profiles with time - first recorded profile undermost, last profile uppermost, centrifugation of an o/w emulsion, 3000 rpm (1100 x g)

The sharp drop in transmission below 89 mm marks the filling height of the sample.
The lowest transmission belongs to the first profile (red). The primary separation process, separation of an aqueous phase, starts from the bottom of the cell. The boundary water -emulsion is moving upwards (last profile green). That is, the separation process is characterized by creaming of oil droplets inside the continuous aqueous phase.

· The type of emulsion oil-in-water (o/w) or water-in-oil (w/o) can easily be deduced from the primary process of destabilization traced by the evolution of transmission profiles.


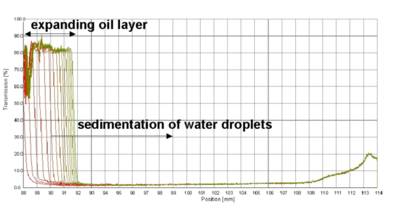
Fig. 3 Evolution of transmission profiles with time - first recorded profile undermost, last profile uppermost, centrifugation of a w/o emulsion, 3000 rpm (1100 x g)

An example of the typical separation behaviour of a water-in-oil (w/o) emulsion is shown in Fig. 3. The primary process of destabilization traced is sedimentation of water droplets inside the continuous oil phase. (The increase of the baseline above 109 mm is due to the transparent cell basement and therefore not related to the separation process.)

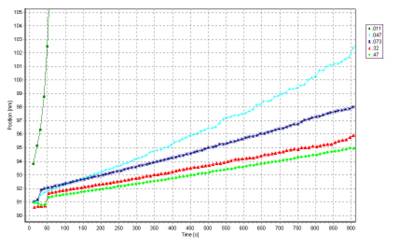
  • The kinetics of creaming (or sedimentation) and oil layer formation as well as the kinetics of coalescence can be analysed and compared with other samples using the integrated software (Fig. 4).


Fig. 4 Kinetics of creaming - left, and of evolution of the oil layer - middle (analysis mode ‘Front Tracking’) as well as of coalescence -right (analysis mode ‘Integral Transmission’) can be easily traced
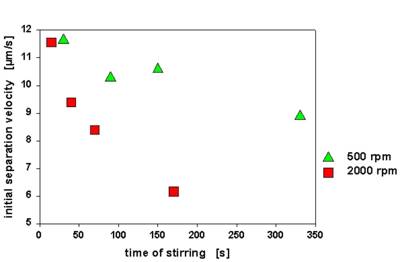
Kinetics of creaming - comparison of emulsion samples taken after different times of processing - after prolonged time of stirring samples are more stable against creaming
Kinetics of oil layer evolution for an o/w emulsion (process depicted in Fig. 2) - after a distinct time lag (formation of a thin extended oil film as a result of coalescence) oil layer thickens with varying speed
Kinetics of coalescence (process depicted in Fig. 2) is traced by the evolution of the average transmission of the cream layer with time

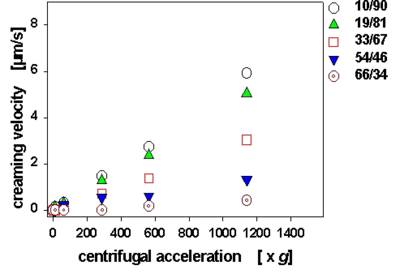
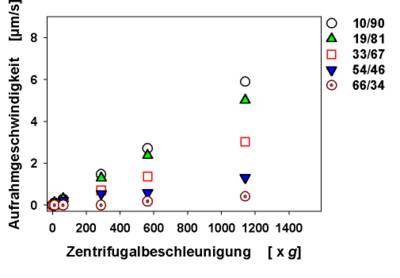
· The dependence of creaming velocity (and of kinetics of other processes traced) on centrifugal acceleration can be measured, which is necessary for extrapolation to normal gravity


Fig. 5 Dependence of creaming velocity on centrifugal acceleration for paraffin oil emulsions as function of paraffin oil / water ratio (m/m).
Centrifugation for 2 hours at varying centrifugal speeds

Examples of application

In the following the ratio of the total liquid separated relative to the entire sample volume was chosen as an easy measure of emulsion stability. The higher this value the lower the stability. After a simple calibration the relation between the radial position and volume can be established.

· Effect of stirring time and emulsifier on emulsion stability

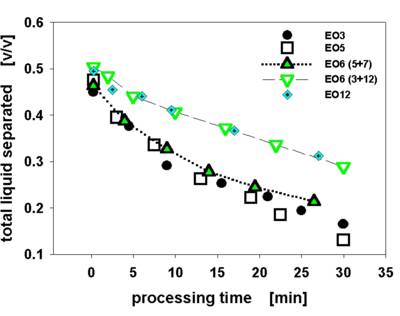
Fig. 6 displays the dependence of emulsion stability on time of processing and emulsifier applied.

Coarse emulsions containing 5 % m/m surfactant were intensively homogenized with a laboratory dissolver. Samples were taken in between 0 and 30 minutes during homogenisation. Values depicted were obtained during one run of the instrument for each emulsifier (commercial ethoxylated surfactants with a varying degree of Ethoxylation – EO).


Fig. 6 Selected results on the change of emulsion stability for rapeseed oil emulsions (1/1 oil/water m/m) as function of processing time and emulsifier applied.
EO6 (5+7) and (3+12) are respective blends of iso Tridecanol (3, 5, 7 and 12 EO) with a nominal ethoxylation degree of 6
Stability evaluated via the ratio of the total liquid separated relative to the entire sample volume.
Centrifugation at 3000 rpm for 43 minutes.

Stability increases almost linearly with processing time after an initial sharp improvement relative to the coarse emulsions. The surfactant with 5 EO units is the most effective emulsifier. Blending of surfactants is often used to adjust the polarity of the emulsifier to the actual need. As obvious from Fig. 6 not only the average polarity is a key in determining emulsion stability but also the oligomer distribution. The performance of the blend “5+7” ranges between the efficiency of emulsifiers with nominal 5 and 7 EO units, however, “3+12” is only as efficient as the emulsifier with 12 EO.

· Effect of HLB-value and temperature on emulsion stability

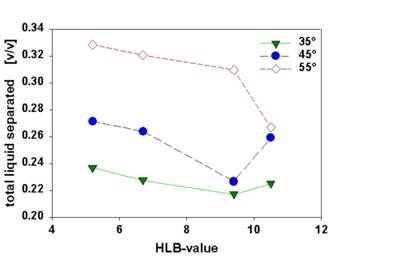
Fig. 7 compiles the effect of HLB-value and temperature on stability of emulsions

o/w Emulsions were prepared at a paraffin oil/water ratio of 1/1 m/m using a mixture of an oil and a water soluble emulsifier. The HLB value of the emulsifier was shifted by varying the emulsifier composition. The temperature dependence of emulsion stability can easily be assessed by centrifugation at different temperatures.


Fig. 7 Dependence of emulsion stability on emulsifier composition (HLB value) and temperature for paraffin oil emulsions (1/1 oil/water m/m).
Stability evaluated via the ratio of the total liquid separated relative to the entire sample volume.
Centrifugation at 3000 rpm for 43 minutes.

Emulsion stability decreases when temperature is increased. Near the optimum HLB value stability is less dependent on temperature. At higher temperatures the optimum HLB is shifted to higher values.


Thursday, December 09, 2004

Selection of lime dispersing agents by multisample analytical centrifugation

Scope

Effective dispersion of lime is required in laundry applications as well as in papermaking, paints and other filed. To this end efficient stabilizers and their right concentration has to be selected.

A multisample technique based on analytical centrifugation is described which allows for an accelerated study of dispersion stability without dilution, thus avoiding changes of dispersion properties.

The efficiency of this approach is demonstrated by evaluation of the optimum dispersant concentration and by screening of a range of potential lime dispersants.

Measurement principle

The LumiFuge measures the intensity of the transmitted light over the full sample length simultaneously as function of time. (Measurement scheme see Fig. 1)


Fig. 1 Lumifuge - Measurement scheme

The data are displayed as function of the radial position, as distance from the centre of the rotation (transmission profiles, see Fig. 2).

At the same time up to 8 different samples can be analysed simultaneously.

By means of the available analysis modes ‘Integral Transmission’ (Clarification) and ‘Front Tracking’ the separation behaviour of the individual samples can be compared and analysed in detail.

Experimental/Results

1 % m/m aqueous lime dispersions were prepared with varying concentrations of sodium alkylbenzene sulfonate (ABS-Na) or with the addition of different dispersing agents. The separation stability was analysed at 1000 rpm (128 x g).


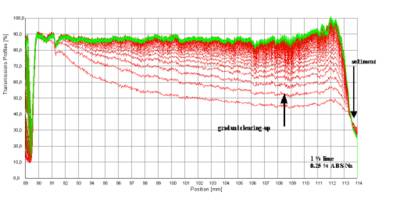
Fig. 2 Evolution of transmission profiles with time - first recorded profile undermost, last profile uppermost, centrifugation of a lime dispersion stabilized by a commercial anionic surfactant, 1000 rpm (128 x g)

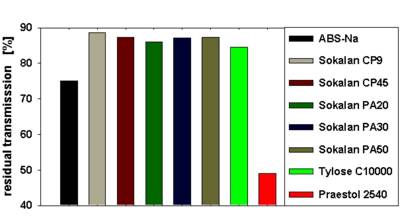
The set of transmission profiles obtained for the dispersion stabilized by an alkylbenzene sulfonate is representative for the sedimentation of a very polydisperse suspension. As an easy measure of stability the transmission after 45 minutes of centrifugation was chosen. To this end the transmission values were averaged over the sample length between the radial position 101 and 103 mm using the analysis mode ‘Integral Transmission’. The higher the transmission the lower the stability. This way the stabilization effect can directly be visualized (Fig. 3 and 4).

Fig. 3 displays the dependence of dispersion stability on concentration of the anionic dispersant. Values depicted were obtained during one run of the instrument.

Fig. 4 shows a direct comparison of the performance of different dispersants. The acryl amide acrylate copolymer is the far most efficient dispersant resulting in the highest residual turbidity (lowest transmission).

From this figure the advantage of comparing multiple samples during one measurement under identical conditions becomes evident.


Fig. 3 Stabilization of lime dispersions by an anionic dispersant - effect of dispersant concentration, high transmission after 45 min of centrifugation means low stability.


Fig. 4 Direct comparison of performance of different dispersants in lime stabilization (0.1 m/m %) - high transmission after 45 min of centrifugation means low stability.

MPK (methyl propyl ketone) as Replacement for MEK Solvents

Product News - Eastman Offers Efficient, Non-HAP Replacement for MEK Solvents

MEK - Methyl ethyl ketone is considered to be a 'HAP solvent'. As I found out this abbreviation means 'Hazardous Air Pollutant'.
MEK has wide ranging applications as solvent for paints, cleaners and paint strippers

Wednesday, December 08, 2004

Lumifuge/Lumisizer/Lumireader - How to determine the position of the bottom of the measuring cells and How to determine volumes (sediment, cream )

The detection principle of the Lumifuge/Lumisizer and Lumireader instruments allows to determine the local position with high precision.

For more advanced applications (determination of sediment heights for example) the knowledge of the position of the bottom of the measuring cells might be necessary. To determine the packing density or to determine the phase ratio of phases separated, it is straight forward to determine these values after calibration by inserting the values obtained for the respective position into an equation.

How to do the calibration ?

The procedure to follow is based on two simple facts

  • mass of samples can be easily measured with high precision
  • the position of the air-liquid interface is easily obtained from the transmission profiles, see below

#1 For a given type of measuring cells, i.e. rectangular plastic cells or glass cells, a set of samples are filled to different heights with water (density equals 1 g / cm³) with the sample mass determined by a semi-analytical balance (± 1 mg).

#2 Transmission profiles of these samples are obtained using the Lumifuge (up to eight samples per measurement) or the Lumireader.

#3 The position of the interface air-water is determined for each sample

#4 Via fitting a convenient equation the dependence volume-position and position-volume can be obtained, which also gives the position relating to ‘zero volume’, i.e. the position at the bottom

Example – calibration of the Lumireader 4160-101 – rectangular plastic cells

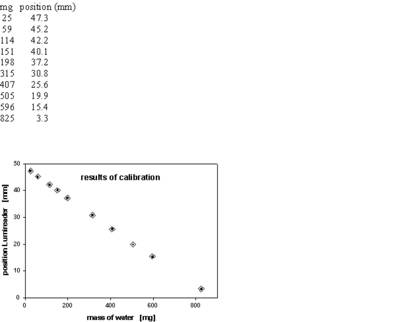
Ten sample cells were filled with water (range 25 mg – 825 mg). For the transmission profiles obtained, see two examples below for 151 and 407 mg, respectively.

For round glass cells with a diameter of 10 mm a range of 150 mg to 5000 mg would be appropriate.

For the Lumifuge with a shorter line detector a range of 20 to 400 mg and 200 – 2700 mg, respectively, is applicable.

One has to take care of the precise placing of the sample cells.


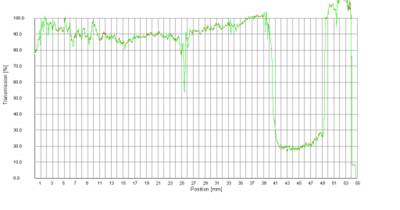
Transmission profiles obtained with the Lumireader 4160-101, plastic rectangular cells, polycarbonate, filled with water 151 (upper figure) and 407 mg (lower figure).

The drop in transmission around position 49 mm (given as distance from the upper end of the CCD line sensor) is caused by the bottom of the cell, however, its position cannot be deduced exactly.

The position of the interface air-water (sharp incline) reads 40.1 and 25.6 mm for the samples with 151 mg (upper figure) and with 407 mg (lower figure), respectively.

These positions correspond to 151 and 407 mm³, respectively.

For the following set of data the results are depicted below


calibration data and plot

Fitted with the equation of type y = a + bx + cx² (eq. 1) one gets

a = 48.78 (position of the cell bottom, i.e. 48.8 mm)

b = - 0.05895

c = 0.000004603

Please note, this is the relation of position as function of the sample mass.

For the determination of volume in relation to the position, however, one needs an equation to compute the volume by inserting the values determined for the position.

The same type of fitting equation might be used as above y = a + bx + cx² (eq. 2)

with y for volume (mm³ or µl) and x for the position.

The regression results in

a = 888.7 (maximum volume traceable, i.e. 888 mm³)

b = -19.56

c = 0.02762

With the knowledge of these parameters and the equation above (eq. 2) one can compute any volume of sediment or the volume of the whole sample. The value of a cream layer or a floating oil layer can be determined by subtracting the volume relating to the position of the interface from the volume of the whole sample accordingly.

Example – Determination of sediment volume and packing density

Below the transmission profile of a flocculated sample of colloidal silica which was measured at gravity to deduce the change in packing density after compaction in a centrifugal field.


Transmission profiles of a flocculated sample of colloidal silica after compaction in a centrifugal field.

The position of the interface air-water is at 25.6 mm relating to a volume of 406 mm³, the position of the sediment interface is at 40.3 mm corresponding to 145 mm³. The layer of water above the sediment, therefore, has a volume of 261 mm³.

The packing density of silica can be expressed in terms of volume fraction:

F = m/(rV) (eq. 3)

with the mass of silica m (in this case 10 mg), a density r of 2.3 g/cm³ or mg/mm³ and the volume of silica V (145 mm³, see above).

According equation (3) the packing density of silica measured results in a volume fraction F of 0.03, very far from a dense packing.


Online Survey of the European Environmental Agency - Air Pollution

IPM V 1.4
"The European Commission is writing an action plan to improve air quality in Europe. It will include measures having a direct influence on our day to day life. The way we move, the way we produce and use energy, the air quality we want, the price of products and services are all at issue in this plan. Therefore your opinion on air pollution and its effects is of great importance to us. It will help us finalize the plan."

Friday, November 19, 2004

Lumifuge-Application Testing Stabilization of carbon black dispersions Part II

Continued see part I
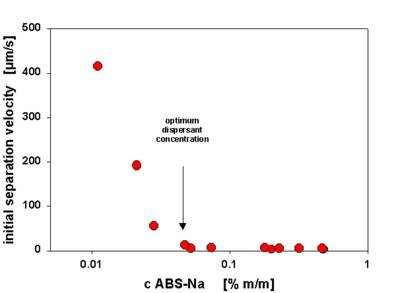
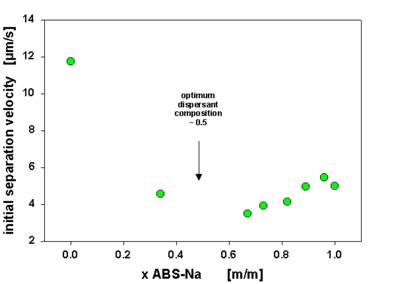
The SepView software also allows to compute the sedimentation velocities. These were used to investigate the concentration effect of the anionic dispersant (Fig. 4), the effect of blending the anionic dispersant with a nonionic surfactant (Fig. 5) and the effect of preparation conditions (Fig. 6).

Fig. 4 Carbon black stabilization by an anionic dispersant - effect of dispersant concentration


Fig. 5 Carbon black stabilization by an anionic-nonionic dispersant mixture - effect of anionic surfactant mass fraction (overall dispersant concentration 0.5 % m/m)


Fig. 6 Carbon black stabilization by an anionic dispersant (0.5 % m/m) - effect of stirring speed and time


Lumifuge-Application Testing Stabilization of carbon black dispersions Part I

Scope

Carbon blacks are widely applied as pigments and fillers in various products (inks, paints, rubber, plastics).

A multisample technique based on analytical centrifugation is described which allows for an accelerated study of dispersion stability without dilution, thus avoiding changes of dispersion properties.

The efficiency of this approach is demonstrated by selection of concentration and composition of stabilizing additives as well as of the preparation conditions for optimum stability.

Measurement principle

The LumiFuge measures the intensity of the transmitted light over the full sample length simultaneously as function of time. (Measurement scheme see Fig. 1)


Fig. 1 Lumifuge - Measurement scheme

The data are displayed as function of the radial position, as distance from the centre of the rotation (transmission profiles, see Fig. 2).

At the same time up to 8 different samples can be analysed simultaneously.

By means of the available analysis modes ‘Integral Transmission’ (Clarification) and ‘Front Tracking’ the separation behaviour of the individual samples can be compared and analysed in detail.


Experimental / Results

0.1 % m/m aqueous dispersions of carbon black were prepared with varying concentrations of sodium alkylbenzene sulfonate (ABS-Na) or with an anionic-nonionic surfactant mixture of varying composition. Further the influence of preparation conditions was evaluated.


Fig. 2 Evolution of transmission profiles with time - first recorded profile undermost, last profile uppermost, centrifugation of a carbon black suspension stabilized by a commercial anionic surfactant, 1500 rpm (285 x g).

The set of transmission profiles obtained for the dispersion stabilized by an alkylbenzene sulfonate is representative for the sedimentation of a polydisperse suspension. The sedimentation speed is inversely proportional to the stabilization achieved. Therefore, the stabilization effect can directly be visualized by comparing the kinetics of sedimentation (Fig.3).


Fig. 3 Comparison of sedimentation kinetics (movement of boundary supernatant - suspension) obtained by the analysis mode ‘Front Tracking’, dependence on surfactant (ABS-Na) concentration (% m/m).

See the following Part II

Thursday, November 18, 2004

Rising pH in Final Treated Effluent Dilemma - Water and Wastewater.com Help Forum

Water and Wastewater.com Help Forum - Rising pH in Final Treated Effluent Dilemma

original question by Sewer Doc
Baffled as to why the final pH in grab samples from our final treated tertiary plant effluent clear well have started increasing by approx. 2.5 pH units (from 7.0 to 9.5) within 60 min. of sample collection. (Previously the pH in clear well grab samples was quite stable). We employ breakpoint chlorination, followed by neutralization with KOH and dechlorination with SBS, followed by sand filtration and 4 hours of vigourous aeration (with clean air). The temperature is presently <14c.>First attempt to answer
indeed very strange. As biological causes can be rouled out chemical reasons are left. That is, surely the KOH is overdosed. The most likely reason is that the quality of your KOH feed has changed.
Normally by standing a KOH solution will take up carbon dioxide and the KOH solution becomes saturated regarding kalium carbonate. The finaly dispersed particles eventually will get into solution only in your final effluent.
Dosing a diluted KOH feed or simply a reduction of the KOH amount may solve the problem.

reply by Sewer Doc
I agree it is a chemical reaction. I ran some experiments today - Whereas the pH increased within 1 hour for samples from the clear well, further upstream (after the sand filter and in one of the aeration tanks), a similar increase occurred but only a lag of about 5 hours and 3 hours, respectively. In the case of the sand filter sample, it did not go through our 3-4 hour aeration step, showing that oxidation of something by air was not responsible for what was happening.

With respect to KOH, we receive 2-3 deliveries of liquid KOH per week - same supplier past 3 years. KOH addition to the dechlor tank is controlled automatically by a on-line sensor which is calibrated regularly and checked against a calibrated lab pH meter. This is carefully controlled to ensure that the water at the point and time of discharge meets our pH limit.

second attempt
treating the system as a black box obviously the KOH feed has to be reduced somewhat to ensure that the discharge is meeting the limit.

To continue the speculation
If indeed the KOH feed contains particulate carbonate this would explain why the on-line sensor allows for overdosing (it does not 'see' the alkalinity provided by the particulate carbonate).
Further, if there is a deviation from ideal mixing this will also lead to overdosing.

Why the shift in pH requires longer times upstream

An alternative explanation to the 'particulate' hypothesis is an oversaturation with carbon dioxide, which leads to formation of a kalium hydrocarbonate solution, which is neutral. I do not know if it is possible that this solution releases carbon dioxide to the air under ambient conditions. This would lead to the formation of a kalium carbonate solution, which is alkaline. This would mean that the oversaturation upstream is stronger.
You might check the hypotesis with a dilute KOH solution.

reply by Grrun
Since you have checked the pH sensor for reliability, then I suggest that you check the KOH pump controls. Another possibility is (if you have one in the system) the back pressure valve for positive displacement pumps; it could possibly fail in the open position or a diaphram could have ruptured. If you don't have a backpressure valve, then KOH could possibly flow through a metering pump if the discharge is lower than the KOH tank.

reply by judo
Just out of curiosity, does the pH of your effluent keep not increasing during "4 hours of vigorous aeration", and suddenly start increasing right after the "grabbing" ?

What would happen if you make the "vigorous aeration time" a bit longer, like another 60 minutes?

reply by Sewer Doc
Thanks for all of the comments and suggestions. We have not tested the particulate suggestion. It is simple enough so we will do so.

All on-line instrumentation & controllers in the plant were professionally calibrated in late Sept. and several have been rechecked since then.

We use Prominent pumps which are 1-2 years old and which appear to be operating well. We run daily drawdown checks.

Regarding aeration, we have observed that aeration holds the pH in check. After ceasing aeration, pH increases. In samples held on the bench and allowed to increase their pH, subsequent aeration reduces pH. Addition of a small amount of Sodium bisulfite to a fresh sample drops pH by about 1 unit and holds it there. If aeration is then turned on, it drives the SBS off and the pH rises to the equivalent pH for aeration alone.

Over the past 6 months, the ammonia concentration in the raw water feed to the tertiary plant has increased significantly. To treat the increased ammonia in the breakpoint chlorination reactors (which were sized to provide sufficient reaction time to treat a much lower ammonia conc.) the hypo dose had to be doubled, to achieve >99.5% ammonia reduction.

As a result, we now find that the residual chlorine concentration in the dechlorination tank is now much higher, requiring double the SBS dose as last year to dechlorinate, and 4x the KOH for adjustment to our target pH. Given the complexity of the water and the high levels of these process chemicals, it probably should not be a surprise that some subtle lingering chemical reaction(s) are occurring in our final treated water which affect its pH over time.

As a trial, we significantly reduced the raw water flow into the tertiary plant yesterday to provide a longer residence time in the chlorination tanks and provide a longer time for aeration in the aeration tanks, to hopefully eliminate these problems.

Reply by Grrun
Usually, acid-base reactions are quite rapid and I don't have a good explanation for the reactions taking place. However, if you are using 4X the KOH that you used previously and your water has a 9.5 pH; it seems to me that you are feeding a strong alkali that is the only likely candidate to cause the pH to rise that high. You may want to change your pH aim to compensate for some change in your influent chemical composition (perhaps even running pH titration curves with KOH and allowing time for any delayed reaction to occur).

Anyway, I hope you'll share the solution to this puzzel with the Forum when you solve it!

Reply by Sewer Doc
I can't really play around with my pH. At the discharge point it must be between 6.5 - 8.5. We strive to control it at about 6.6, but this is not that easy since the effluent buffers poorly in this pH zone. The pH change happens thereafter, where it impacts the testing of samples sent to off-site labs for other compliance tests.

Filtering the effluent as was suggested by another respondent did not help. Nor did cutting the raw water flow into the plant down to 100 usgm (from 240 usgm a few weeks ago). In all cases the pH rose quickly as the samples "aged"

Re: the point about stoichiomentry, I believe the overal reaction for break point chlorination is: 3NaOCl + 2NH3 --> N2 + 3NaCl + 3H2O I am sure that we are adding much more NaOCl than this as a lot of the chlorine is lost to atmosphere from the tanks. We try to minimize NaOCl dose by targeting the ammonia conc. in the treated effluent from the chlorination tanks to be between 0.5 - 1.5 mg/L.

We have now sought the assistance of a good inorganic chemist I know. If we find the cause of the problem, I will be happy to post an update.

This problem, while scientificallly interesting, is something I really wish would go away.


next answer
as mentioned earlier to high pH in the effluent means the input of alkalinity is too high, even if your on-line pH reading says it is okay.
So why not reducing the amount of KOH added?

After all the slow shift in pH seems to be indeed associated with the degree of carbon dioxide over-saturation, i.e. with a shift from hydrogencarbonate (neutral) to carbonate (alkaline).


Reply by Sewer Doc
At the point and time the discharged effluent leaves my plant, it must be between pH 6.5 to 8.5 otherwise I am not compliant. We successfully maintain the the pH at 6.6, as measured by an on-line pH meter. In the past, we never had this problem - th pH recorded on line was close to the pH reported by off-site labs (i.e. the pH was stable). The biggest concern we have about pH changing after the sample has been collected is its potential effects on off-site biotoxicity tests, where the high pH can cause problems.

reply
I hope I now got the point.
Your dilemma is to chose between the 'appropriate' on-line readings and off-site lab readings.

What happens when you reduce your KOH by 10 %? Does the on-line pH meter drops well below 6.5? I would suspect not. So I suspect there should be a potential to lower KOH feed without resulting pH values below 6. By the way, there are absolutely no negative biological effects at a pH of 6.

On the other hand if one has to chose between on-line and off-site (equilibrium values) I would deside for the equilibrium values. For documentation you might establish the correlation between on-line readings and 'degassed' lab pH values.

Reply by Sewer Doc
The buffering capacity is very poor at pH 6.6 and over my entire compliance range of 6.5 - 8.5. This is my regulatory limit. There is no way I could reduce KOH 10% without falling well below my lower limit.

Quite simply, in my country it would be a legal offence for my company to discharge treated effluent whose measured pH at the point of discharge lies outside of this limit. To do so can lead to severe fines ($$$$) and to possible time in jail

We believe that the actual pH at our final discharge point is being accurately measured and that the increase in grab samples over time is also accurate, being caused by some slow chemical reaction which we presently have not identified. Hopefully the inorganic chemist we have brought in will be able to shed light on this very challenging and puzzling problem.

reply
I am very sorry to hear that you would be send to jail for discharging deonized water or rainwater saturated with carbon dioxide, which has a pH below 6.

I am quite sure that your problem has something to do with elevated electrolyte concentrations and dissolved carbon dioxide, which is gradually released over time.

I don't know if this is again a silly suggestion. What about replacing all or part of the KOH with lime or magnesiumhydroxide? This would lead to a reduction in salt concentrations in the effluent.

reply by Grrun
I'd like to resurrect this topic because I have found the investigation so interesting and I hope that Sewer Doc discovers a solution to the problem even if he cannot determine the root cause. Generally, the pH of the discharge is the legal requirement and I thought that there was also a time constraint on measuring pH on wastewater samples. My memory may be faulty, but I also thought that the pH on toxicity test samples was adjusted if it was outside a specific range. Anyway, I suspect that this problem may not be so uncommon, but Sewer Doc's situation of having the pH change affect subsequent testing may be the uncommon situation.

Additional thoughts that have occurred to me and that are the location of the process control pH probes. Are the probes located directly in the discharge stream or they fed on a side stream (this sometimes occurs for ease of maintenance). The time and mixing that occurs after the water has passed by the probes may contribute to the problem (not being able to observe operations directly does inspire a lot of guessing). When pH probes are not cleaned frequently, the response may become sluggish which may cause over control of the system. Because process flows have increased significantly, I would also suspect that this may somehow contribute to the problem. While we have been exploring the possible chemical reaction aspects of his problem, I've been trying to think of other reasons that may cause the observed phenomena.

reply by Sewer Doc
We are still working on the problem with the help of an inorganic chemist. I have nothing new to report as the experimental test results are not complete. When I have more information, I will update. We are presently looking to see if the problem is due to residual sulfite in the treated water (this is added as antichlor after break point chlorination.).

Let me assure you that the pH effect is not an artifact of on-line probe location. When we take a grab sample from the clear well, and measure its pH immediately using a calibrated lab pH meter, we get approx. the same pH as the on-line measurement (about pH 6.6). We then leave the grab sample beaker sit on the lab bench and monitor pH at frequent intervals. We have been finding that the pH increases to 9 or more, usually within 1 to 2 hours.

Regarding the toxicity test, our final effluent must pass the 96h rainbow trout acute toxicity test with no more than 50% kill at 100% effluent concentration. The toxicity tests are conducted by a certified lab following the Environment Canada Protocol which does not allow for pH adjustment. By the time the toxicity lab receives the sample, the pH is above 9 and this is certainly a factor causing stress on the test fish.

With respect to location of the pH probes, we have on-line pH probes in the first chlorination tank of the break-point chlorination system, in the dechlorination tank and in the final clear well just before the discharge point. The water from the dechlor tank passes through a sand filter and from there passes through 2 aeration tanks in series (total HRT about 4 hours) before entering the clear well. All pH probes were prefessionally calibrated just before starting this years operation. The probes were rechecked by them when the pH problem became evident. Our operators clean and check the calibration of the on-line pH probes against pH 4 and 7 standards every day, and against a calibrated lab Hach pH meter

Please keep the suggestions rolling. Thanks.


reply
Dear Sewer Doc,

after all the problem seems pretty clear to me, i.e. does not require any further extended investigations.

The problem is the very high KOH consumption leading to high kalium carbonate concentrations in the effluent. Aeration changes this to hydrocarbonate (near neutral pH) via dissolution of carbon dioxide, when left standing this reverses to carbonate (high pH).

Instead of buffering the effluent by addition of gypsum it seems more resonably to replace a part of the KOH or all by an insoluble base, i.e. lime. The prefered solution, however, should be to reduce the cause of the high consumption.

reply by Grrun

Using lime rather than potassium hydroxide for neutralization is less desirable from the operational problems associated with using either slaked lime or calcium hydroxide slurry. However, the calcium may place less stress on the rainbow trout than the residual potassium.

Sobish may have a good point; I didn't realize that potassium carbonate could flip back and forth when alkaline. You might try purging samples after dechlorination ultrasonically to remove dissolved carbon dioxide before neutralization to see if carbon dioxide/carbonate is the culprit causing this problem.

Also, the concentrated potassium hydroxide may contain substantial amounts of carbonate (possibly from air contact during storage or transport) which may be contributing to the problem if Sobish's hypothesis is correct.

Finally, I wonder if the pH of samples agitated with nitrogen, rather than air (in a covered beaker to exclude contact with ambient air) would decrease.

Since the problem has occurred concurrently with a substantial increase in waste load, you may want to see what can be accomplished with a pollution prevention program or at least controlling the discharge of waste at the source. This approach usually pays dividends in overall cost reduction and while it doesn't solve your problem immediately may reduce the potential for future compliance problems.

up-date by Sewer Doc
Thanks Sobisch and Grrun for you comments on the carbonate. We will have to reflect on this before I comment further.

Use of lime would be a logistics problem for application given the design and layout of our tertiary plant. In addition, we have to meet a TSS limit of <10 mg/L. The tertiary plant is not a perminent structure. It was originally meant to operate for 1 or 2 years as a temporary add-on solution until our new wastewater treatment plant was built. The existing WWTP is old and overloaded and this is the core reason for all of the problems. The new plant will be fully on line next year (target July).

I agree 100% with the suggestion that the solution of the problem must start "at source" and we in fact have been doing a lot of work in this area to identify the main sources and causes for material losses to our sewers. We will continue to focus in this area even after the new WWTP comes on line. We see a lot of economic as well as environmental benefits resulting from this approach.

Experimental update: With the help of a chemist, we have been looking at the influence of aeration at different pH's in our experiments into the cause of the pH increase to help identify possible chemicals responsible for the pH rise. It was hoped that aeration of acidified effluent (to better drive off residual sulfite) would eliminate the problem but this did not improve the situation. We are repeating the experiment at high pH to see what will happen. In addition, we will also be comparing aeration against bubbling nitrogen gas and bubbling pure oxygen and have some other experiments in mind. These should be completed in a couple of weeks and I will update this forum then.

Tuesday, November 16, 2004

Recreating a 2,000-year-old cream - New formula for a cosmetic giving a pale complexion?

news @ nature.com?-?Recreating a 2,000-year-old cosmeticbreaking science news headlines

citationThe researchers report in this week's Nature that the two major components, each making up about 40% of the total, were starch and animal fat.
The original cream is harder and more granular than the replica, but Evershed suspects that this is down to centuries of microbial action; the fat is likely to have changed most.

The remaining ingredient was synthetic tin oxide (or cassiterite). Although it is greyish in its natural state, it would have coloured the cream white. "If you mix the starch and fat together, you get quite a nice hand cream, but when you add the tin you get a translucent, white cream," says Evershed.

Question The microbial action on the fat might be questioned. I would expect a serious degradation over the years. It seems more likely that the fat base and/or starch were different or differently treated. Also a slow fat abiotic degradation catalized by the tin oxide seems to be possible.

I guess the cream is a water-in-oil emulsion?


see also Spincontrol ups efficacy testing for skin whitening products

Solar cell for conversion and storage of solar energy

PhysicsWeb - News - A new type of solar cell (November 2004)

4 November 2004

Scientists in Japan have made the first device that can convert solar energy into electricity and then store the resulting electric charge. The "photocapacitor" designed by Tsutomu Miyasaka and Takurou Murakami at Toin University in Yokohama could be used to power mobile phones and other hand-held devices (Appl. Phys. Lett. 85 3932).

The Japanese device consists of two electrodes -- a light-absorbing photoelectrode made of semiconducting titanium dioxide and a counterelectrode made of platinum coated glass -- separated by a resin film. Both electrodes include a porous layer of activated carbon that has a large surface area. All three layers are filled with an ionic solution and form a capacitor that has a light collection area of 0.64 square centimetres.


Thursday, November 11, 2004

ARP - Ammonia Recovery Process - ThermoEnergy, Wastewater Treatment

ThermoEnergy, Wastewater Treatment

ARP Process Description
cited from website

The ammonia laden solution is first pumped to ammonia adsorption columns where the ammonia is "pulled" from the water by specially prepared ion exchange resins loaded in the columns. A solution of zinc sulfate and sulfuric acid regenerates the ion exchange columns, flushing the regeneration solution to an evaporator where it is concentrated to approximately 60,000 parts per million (ppm). This concentration is then cooled until zinc ammonium crystals form. These crystals are then collected and roasted to drive off the ammonia, which is captured in a packed bed sulfuric acid scrubber where ammonium sulfate forms. The recovered ammonium sulfate crystals are dried, bagged and shipped to wholesale markets worldwide. Ammonium phosphate can be made by altering the type of acid used in the front end of the regenerating process.


Research on Tumbleweeds for killing people efficiently after long-lasting pain

Pollution Online News for pollution control professionals

From the discussion forum of the Bioremediation Group Bio@bioremediationgroup.org

Dear All,

two citations from the 'news-wire'

Depleted uranium (DU) is used in armor-piercing munitions. Although it produces only a low level of radiation, the metal poses a hazard in soils because it - like some other heavy metals - is toxic if ingested.

Ulmer-Scholle's work is funded by the U.S. Department of Defense, which is looking for innovative, cost-effective, and efficient ways of cleaning up soils at weapons testing areas and battlefields where DU has been used.


So it is time to raise some ethical questions, which deserve to be a central issue of research.

As the application of depleted uranium implies severe health effects for military and civil persons it equals application of chemical weapons.
Prevention is better than cure.

Money, time and human intelligence should not be spent on killing people 'cost-effectively'.

I hope most of BioGroup members can agree on this point.

Reply by Christian McGrath

Speaking only for myself (certainly NOT for the US Army), I welcome any tool that helps in the mission to contain and, when necessary, destroy the enemies of freedom and democracy.

I perceive the environmental impacts of DU in armor-piercing weapons to be comparable with less frightening heavy metals such as chromium or lead -- a serious issue, but not insurmountable. Obviously, there is little concern for the health effects on the occupants of a target tank, but there is certainly concern for the health of the soldiers, civilians, and post-conflict effects. That is why the Army continues to develop ways to reduce exposure and clean up the residue. The immediate health concerns are due to the atomization and potential inhalation of the DU after impact. In military training ranges, DU weapons also can glance off targets and scatter in pieces or intact.

I agree that we should look for alternative ways to immobilize enemy tanks or pierce armor. If for no other reason than to save money in cleanup operations, that search is ongoing.

All war is a sickening waste of lives and resources; it is a hideous, painful, and destructive endeavor, never to be entered into lightly.

Personally, I believe that there must be better ways to constrain or convince the enemies of freedom to abandon their oppressive ways. That may be a naively rational, civilian, or Christian perspective (also a true Muslim, Jewish, Hindu, and Buddhist one ... evidence of how little secular democracies pay attention to religion between elections). The power of dictators is a severe challenge to overcome because they are driven by avarice and self-preservation and rarely encumbered by honor or decency.

Your concerns are well founded and appreciated, even within the military. But until the world is free of violent aggressors, the struggle between freedom and oppression will continue. The elimination of oppression sometimes will require overwhelming force, perhaps at the cost of reversible environmental damage.

reply

We certainly disagree on the point that it is necessary to destroy the enemies of freedom and democracy.

But I still hope that we can both come to the conclusion that the end does not justify every means.

Every wrongdoing in the name of freedom and democracy corrupts freedom and democracy. When accepting poisoning of the Iraqi civilian population with depleted uranium the US gets very close to Saddam poisoning his own population. Never forget the application of Agent Orange in the Vietnam

war!

reply Christian McGrath I appreciate your response and agree that there should be (and there are) limits on the weapons that should be used. We don't use chemical or nuclear weapons anymore. But what would you do if you had a DU weapon in your hands and a terrorist was driving his tank into your home, intent on killing you and your family? Some people are so rabidly hateful or on some delusional mission from 'god', that only deadly force can stop them. Sometimes there is no time or room for reason or talk of peace. You don't talk calmly to a charging lion ... and you can't outrun her.

reply given its nature depleted uranium is a kind of chemical weapon, even if its main intent is different. I would judge this from the point of the action.

I certainly will not have a DU weapon at hand when a terrorist threaten killing me. It is my tiny contribution that I will give them not the slightest reason to do this.

I know this might not stop them. However killing innocent people in the name of freedom and democracy is a good breading ground for terrorists.


Reply by Louis Barreales
absolutely agree with U.
Taking into account that this new could be worth in the future as
innovative, cost-effective tech, on the other hand this topic sounds so
surreal.
It is not the first time I'm in contact with it, since we have prepared and
gained several tenders for the Army to investigated contamination
associated with lead, TNT, etc, in ammunition within test sites.
The last new I've got about environment related to war weapons is that the
US Army / Navy / AF are considering to replace the lead and other toxic
chemicals in ammunition by "more healthy and ecological" metals and
chemicals. Is it not unbelievable? So, the main concern is the
environmental liabilities of bombarded and bursted areas!!!! What about the
human life?
Human beings must be turned mad


reply by Ashwani Vasishth:
I agree, and am actively opposed to the use of DU munitions. My purpose in sending the message to the list was two-fold--to the extent that DU munitions are currently in use, its good to know that we can remediate some of the adverse impacts; and I hoped that reading the item would get people to ask exactly the sorts of questions you raise.

see also discussion Depleted Morality

Friday, October 29, 2004

Einfluß der Zusammensetzung nichtionischer Tenside auf den HLB-Wert für optimale Emulsionsstabiliät

Vorgestellt auf DECHEMA/GVC-Jahrestagungen 2004 - Karlsruhe 12. - 14. Oktober

siehe auch

Stability analyser Lumifuge 116 for rapid evaluation of emulsion stability and demulsifier selection

D. Lerche, T. Sobisch, S. Küchler, 2002

Rapid emulsifier selection and evaluation of emulsion stability by analytical centrifugation

T. Sobisch, D. Lerche, 2004

Chemistry Preprint Archive, Volume 2002, Issue 6, June 2002, Pages 195-201
Chemistry Preprint Archive, Volume 2004, Issue 5, May 2004, Pages 7-18


Motivation

Der HLB-Wert repräsentiert die Gesamtpolarität des Emulgators, unabhängig von der Zusammensetzung - egal ob Einzeltensid, Mischung zweier Tenside oder Gemisch mit breiter Verteilung. Andererseits ist bekannt, daß die Geometrie der Tensidmoleküle und ihre Packungsdichte in den Adsorptionsschichten einen deutlichen Einfluß auf Typ und Stabilität der Emulsion hat.

Neben dem summarischen HLB-Wert sollte die Tensidzusammensetzung einen wesentlichen Einfluß ausüben.

Für das Emulgatorsystem iso-Tridekanol/ethoxylierte iso-Tridekanole wurden entsprechende Untersuchungen mittels analytischer 'Multiproben' Zentrifugation untersucht.

Experimentelles

Die Messungen wurden mit dem Stabilitätsanalysator LUMiFuge 116 durchgeführt.

Diese analytische Zentrifuge mißt lokale und zeitliche Änderungen der Transmission bei 880 nm zeitgleich während der Zentrifugation.

8 verschiedene Proben können gleichzeitig bei Temperaturen bis zu 60 °C vermessen werden.

Der Entmischungsprozeß kann als zeitliche Änderung der Transmission oder der Position der Phasengrenze dargestellt werden, wobei sich letztere
mit hoher Genauigkeit bestimmen läßt.

Welche Informationen liefert die Analytische Zentrifugation


Unterscheidung o/w oder w/o Emulsion, die Abscheidung der kontinuierlichen Phase ist der primäre Entmischungsprozeß


Abhängigkeit der Entmischungsgeschwindigkeit von der Zentrifugalbeschleunigung


Untersuchung der Kinetik der Entmischungsprozesse

Einfluß von Mischdauer, Emulgatorzusammensetzung, Temperatur
Paraffinöl-Wasseremulsionen (1/1 v/v), Emulgator 5%, Dissolver 5000 rpm


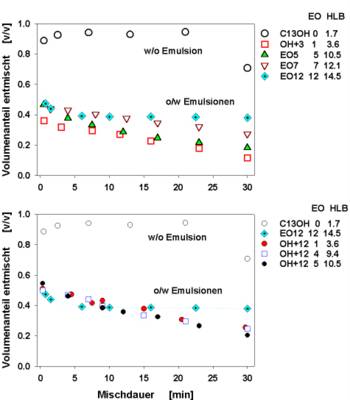
Abhängigkeit der Emulsionsstabilität von der Mischdauer,
vom HLB-Wert ethoxylierter iso Tridekanole und von Mischungen mit iso Tridekanol.


# klare Synergieeffekte iso-C13-OH/EO12
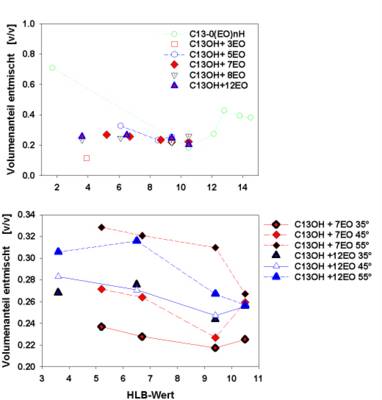
# Kinetik und Stabilität unabhängig HLB 4 - 10 (analog C13OH + 5 EO, siehe oben)


Abhängigkeit des HLB Optimums von der Zusammensetzung der Tensidmischung und der Temperatur

# ab EO7 ist die Emulsionsstabilität unabhängig vom HLB-Wert # Mischung C13OH/EO3 ermöglicht erhöhte Stabilität # Temperaturerhöhung über 45 °C verschiebt HLB Optimum # Mischungen mit höher ethoxylierten Tensiden sind weniger temperatursensitiv