Scope
Selection of emulsifiers and evaluation of emulsion stability is a frequent task. This relates to practical issues like formulation of emulsions, optimization of manufacturing, quality control, shelf life prediction and breaking of emulsions.
A multisample technique based on analytical centrifugation is described which allows for an accelerated characterization of emulsions without dilution, thus avoiding changes of emulsion properties.
Measurement principle
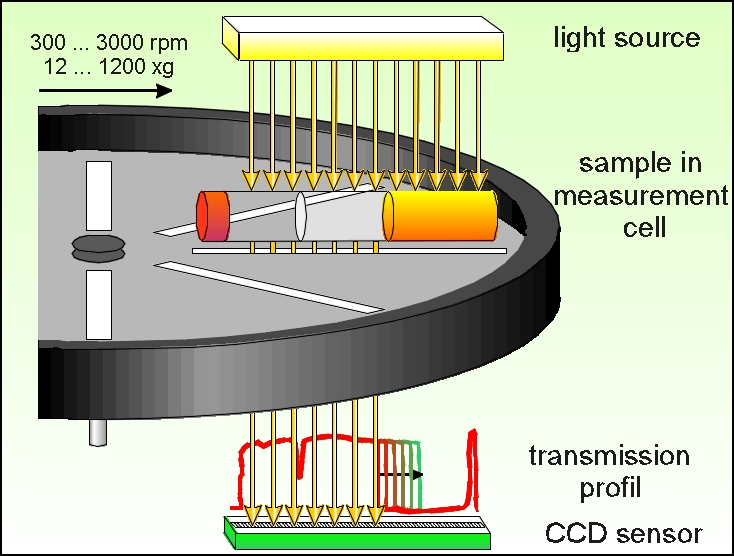
The Lumifuge measures the intensity of the transmitted light over the full sample length simultaneously as function of time. (Measurement scheme see Fig. 1)
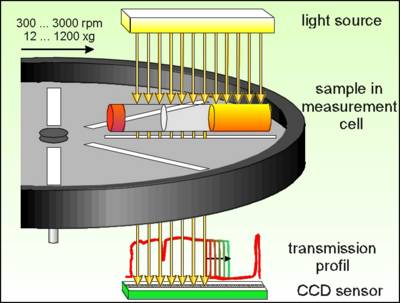
Fig. 1 Lumifuge - Measurement scheme
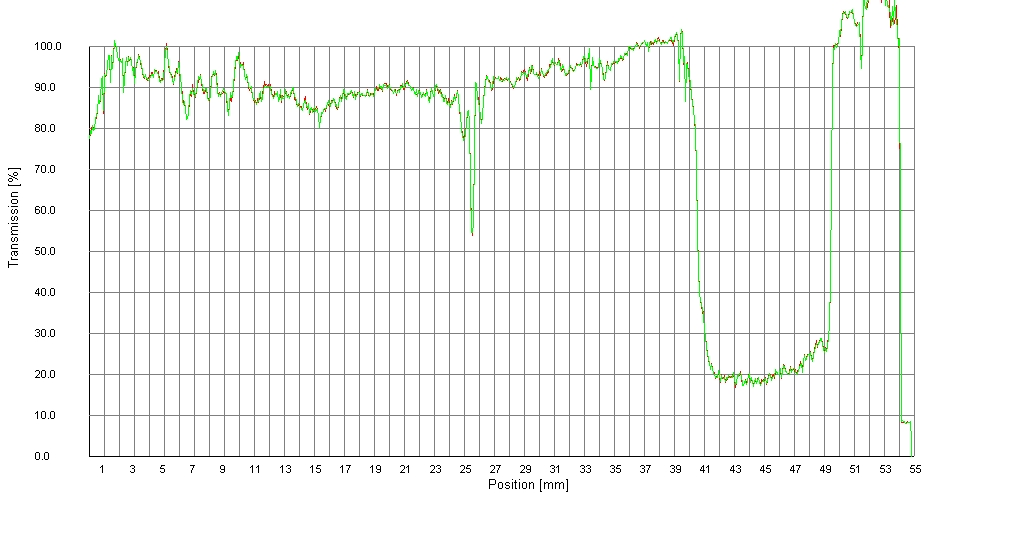
The data are displayed as function of the radial position, as distance from the centre of the rotation (transmission profiles, see Fig. 2).
At the same time up to 8 different samples can be analysed simultaneously at temperatures up to 60 °C.
By means of the available analysis modes ‘Integral Transmission’ (Clarification) and ‘Front Tracking’ the separation behaviour of the individual samples can be compared and analysed in detail.
Information accessible by analytical centrifugation
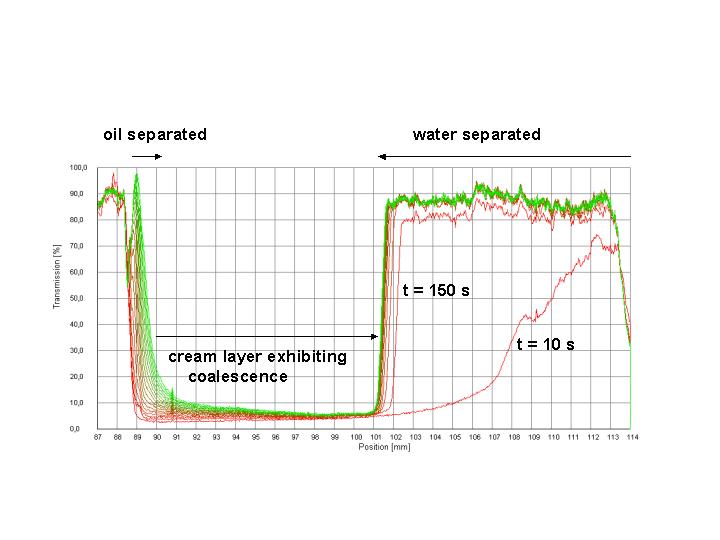
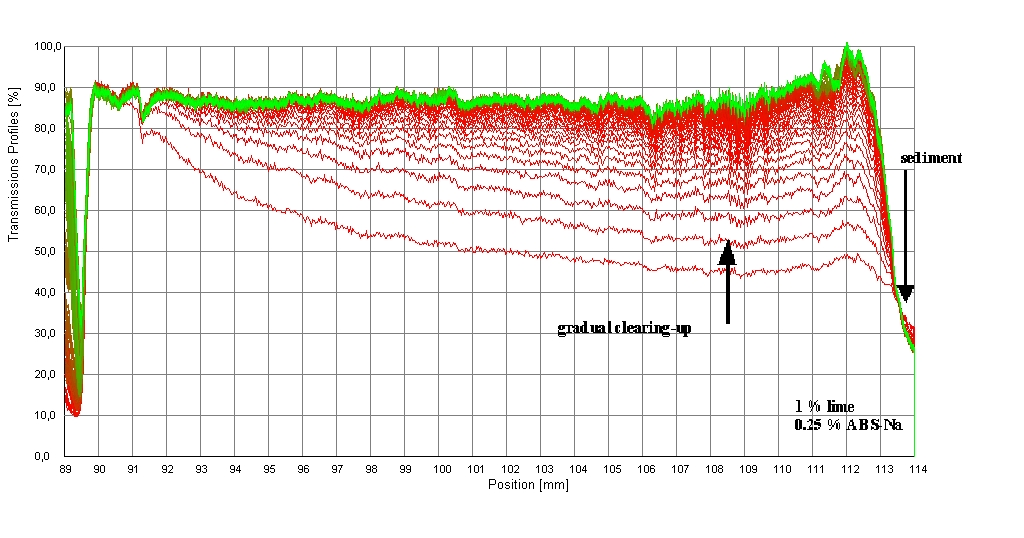
Figure 2 shows as an example the set of transmission profiles obtained for an oil-in-water (o/w) emulsion analysed at 3000 rpm (1100 x g).
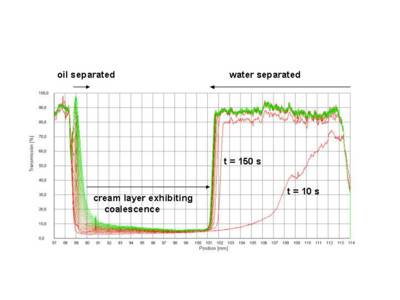
Fig. 2 Evolution of transmission profiles with time - first recorded profile undermost, last profile uppermost, centrifugation of an o/w emulsion, 3000 rpm (1100 x g)
The sharp drop in transmission below 89 mm marks the filling height of the sample.
The lowest transmission belongs to the first profile (red). The primary separation process, separation of an aqueous phase, starts from the bottom of the cell. The boundary water -emulsion is moving upwards (last profile green). That is, the separation process is characterized by creaming of oil droplets inside the continuous aqueous phase. · The type of emulsion oil-in-water (o/w) or water-in-oil (w/o) can easily be deduced from the primary process of destabilization traced by the evolution of transmission profiles.
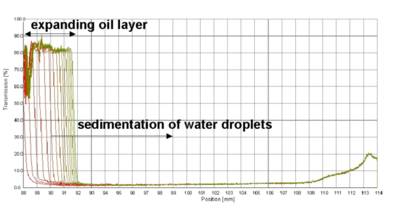
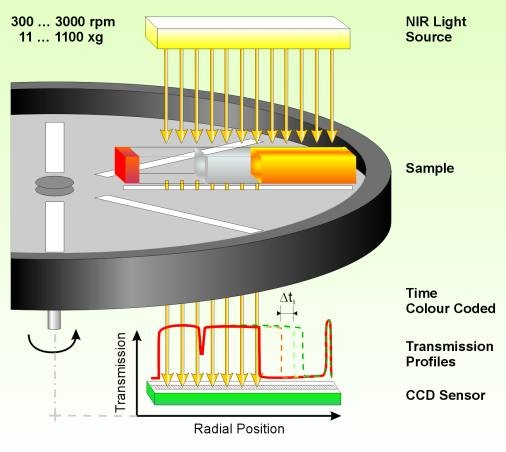
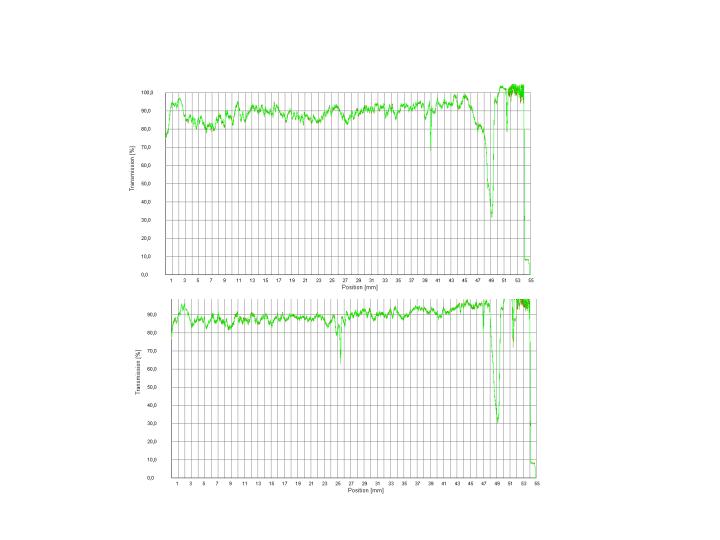
Fig. 3 Evolution of transmission profiles with time - first recorded profile undermost, last profile uppermost, centrifugation of a w/o emulsion, 3000 rpm (1100 x g)
An example of the typical separation behaviour of a water-in-oil (w/o) emulsion is shown in Fig. 3. The primary process of destabilization traced is sedimentation of water droplets inside the continuous oil phase. (The increase of the baseline above 109 mm is due to the transparent cell basement and therefore not related to the separation process.)
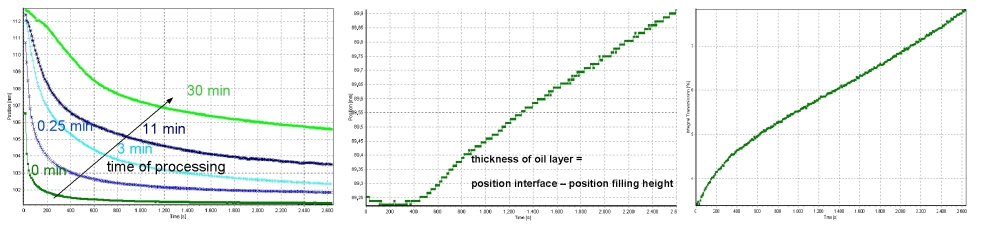
- The kinetics of creaming (or sedimentation) and oil layer formation as well as the kinetics of coalescence can be analysed and compared with other samples using the integrated software (Fig. 4).
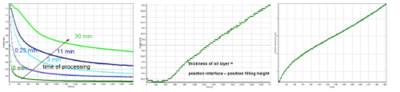
Fig. 4 Kinetics of creaming - left, and of evolution of the oil layer - middle (analysis mode ‘Front Tracking’) as well as of coalescence -right (analysis mode ‘Integral Transmission’) can be easily traced
Kinetics of creaming - comparison of emulsion samples taken after different times of processing - after prolonged time of stirring samples are more stable against creaming
Kinetics of oil layer evolution for an o/w emulsion (process depicted in Fig. 2) - after a distinct time lag (formation of a thin extended oil film as a result of coalescence) oil layer thickens with varying speed
Kinetics of coalescence (process depicted in Fig. 2) is traced by the evolution of the average transmission of the cream layer with time
· The dependence of creaming velocity (and of kinetics of other processes traced) on centrifugal acceleration can be measured, which is necessary for extrapolation to normal gravity
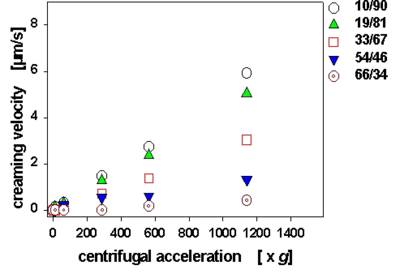
Fig. 5 Dependence of creaming velocity on centrifugal acceleration for paraffin oil emulsions as function of paraffin oil / water ratio (m/m).
Centrifugation for 2 hours at varying centrifugal speeds
Examples of application
In the following the ratio of the total liquid separated relative to the entire sample volume was chosen as an easy measure of emulsion stability. The higher this value the lower the stability. After a simple calibration the relation between the radial position and volume can be established.
· Effect of stirring time and emulsifier on emulsion stability
Fig. 6 displays the dependence of emulsion stability on time of processing and emulsifier applied. Coarse emulsions containing 5 % m/m surfactant were intensively homogenized with a laboratory dissolver. Samples were taken in between 0 and 30 minutes during homogenisation. Values depicted were obtained during one run of the instrument for each emulsifier (commercial ethoxylated surfactants with a varying degree of Ethoxylation – EO).
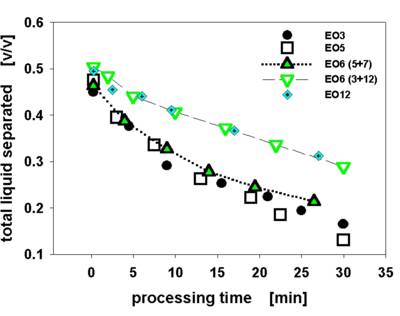
Fig. 6 Selected results on the change of emulsion stability for rapeseed oil emulsions (1/1 oil/water m/m) as function of processing time and emulsifier applied.
EO6 (5+7) and (3+12) are respective blends of iso Tridecanol (3, 5, 7 and 12 EO) with a nominal ethoxylation degree of 6
Stability evaluated via the ratio of the total liquid separated relative to the entire sample volume.
Centrifugation at 3000 rpm for 43 minutes.
Stability increases almost linearly with processing time after an initial sharp improvement relative to the coarse emulsions. The surfactant with 5 EO units is the most effective emulsifier. Blending of surfactants is often used to adjust the polarity of the emulsifier to the actual need. As obvious from Fig. 6 not only the average polarity is a key in determining emulsion stability but also the oligomer distribution. The performance of the blend “5+7” ranges between the efficiency of emulsifiers with nominal 5 and 7 EO units, however, “3+12” is only as efficient as the emulsifier with 12 EO.
· Effect of HLB-value and temperature on emulsion stability
Fig. 7 compiles the effect of HLB-value and temperature on stability of emulsions o/w Emulsions were prepared at a paraffin oil/water ratio of 1/1 m/m using a mixture of an oil and a water soluble emulsifier. The HLB value of the emulsifier was shifted by varying the emulsifier composition. The temperature dependence of emulsion stability can easily be assessed by centrifugation at different temperatures.
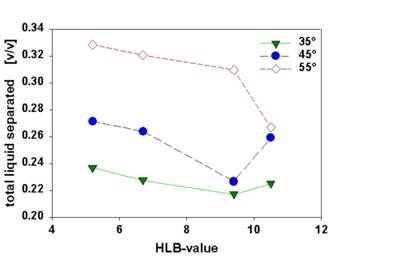
Fig. 7 Dependence of emulsion stability on emulsifier composition (HLB value) and temperature for paraffin oil emulsions (1/1 oil/water m/m).
Stability evaluated via the ratio of the total liquid separated relative to the entire sample volume.
Centrifugation at 3000 rpm for 43 minutes.
 Emulsion stability decreases when temperature is increased. Near the optimum HLB value stability is less dependent on temperature. At higher temperatures the optimum HLB is shifted to higher values.